| __timestamp | Adobe Inc. | Nutanix, Inc. |
|---|---|---|
| Wednesday, January 1, 2014 | 622080000 | 60912000 |
| Thursday, January 1, 2015 | 744317000 | 100959000 |
| Friday, January 1, 2016 | 819908000 | 170787000 |
| Sunday, January 1, 2017 | 1010491000 | 327331000 |
| Monday, January 1, 2018 | 1194999000 | 386030000 |
| Tuesday, January 1, 2019 | 1672720000 | 304128000 |
| Wednesday, January 1, 2020 | 1722000000 | 286689000 |
| Friday, January 1, 2021 | 1865000000 | 291906000 |
| Saturday, January 1, 2022 | 2165000000 | 321156000 |
| Sunday, January 1, 2023 | 2354000000 | 332187000 |
| Monday, January 1, 2024 | 2358000000 | 324112000 |
Cracking the code
In the ever-evolving tech landscape, understanding cost efficiency is crucial. Adobe Inc. and Nutanix, Inc. offer a fascinating study in contrasts. From 2014 to 2024, Adobe's cost of revenue surged by approximately 280%, reflecting its expansive growth and market dominance. In contrast, Nutanix's cost of revenue increased by around 430%, indicating its aggressive scaling strategy.
Adobe's cost efficiency is evident, with its cost of revenue consistently outpacing Nutanix by a factor of 5 to 7 times. This disparity highlights Adobe's established market position and operational efficiency. Meanwhile, Nutanix's rapid growth trajectory underscores its commitment to capturing market share in a competitive environment.
As we look to the future, these trends offer valuable insights into the strategic priorities and financial health of these tech titans. Understanding these dynamics is key for investors and industry watchers alike.
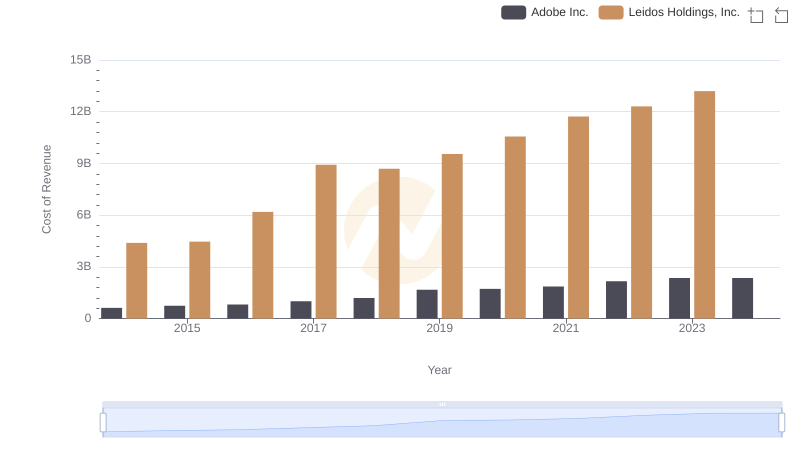
Comparing Cost of Revenue Efficiency: Adobe Inc. vs Leidos Holdings, Inc.
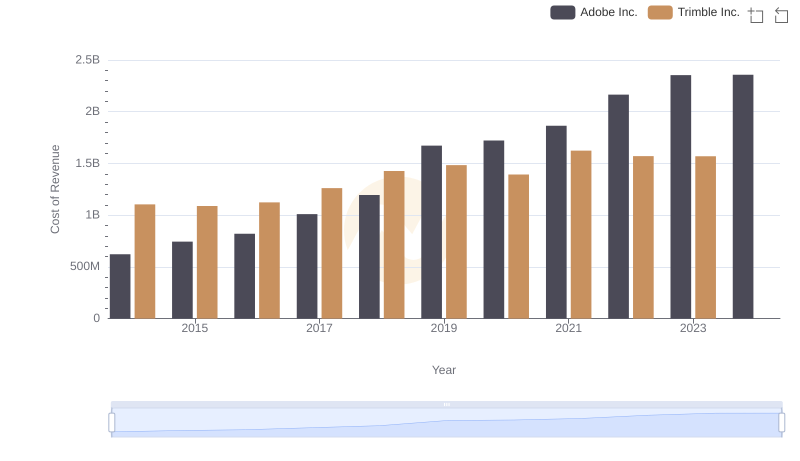
Cost Insights: Breaking Down Adobe Inc. and Trimble Inc.'s Expenses
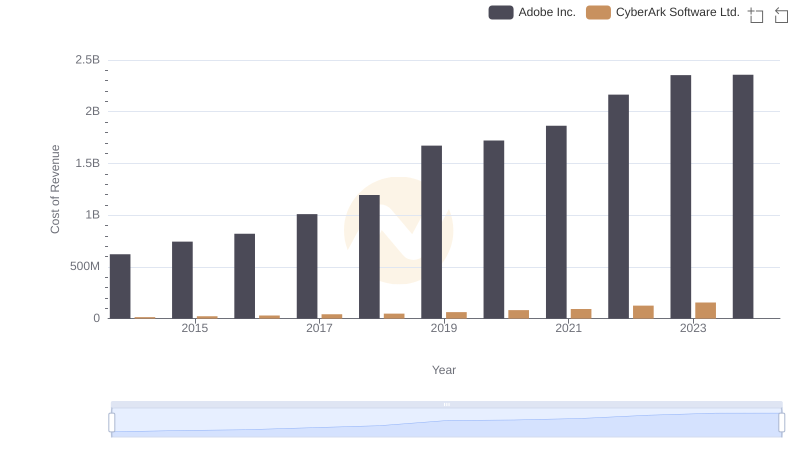
Cost Insights: Breaking Down Adobe Inc. and CyberArk Software Ltd.'s Expenses

Adobe Inc. vs Teradyne, Inc.: Efficiency in Cost of Revenue Explored
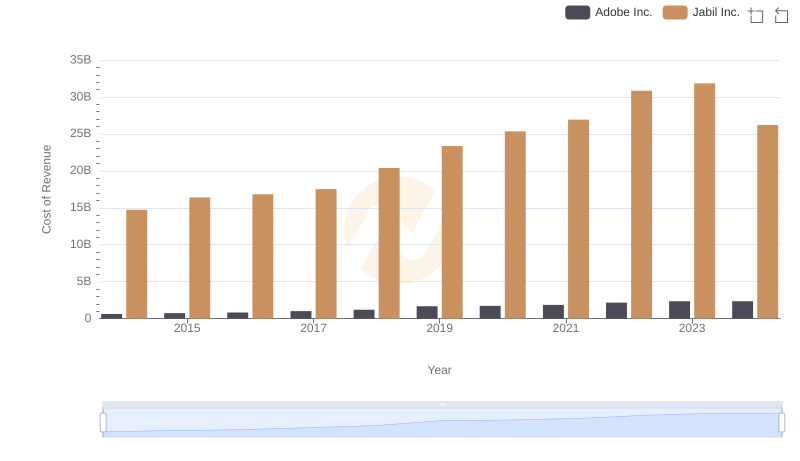
Comparing Cost of Revenue Efficiency: Adobe Inc. vs Jabil Inc.
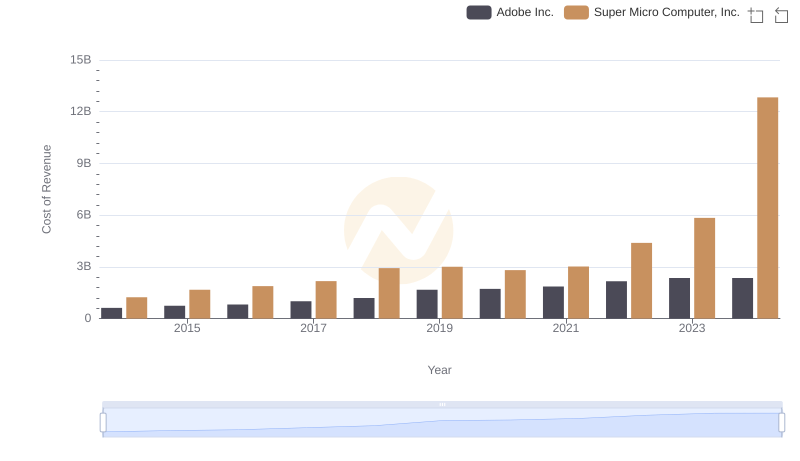
Cost Insights: Breaking Down Adobe Inc. and Super Micro Computer, Inc.'s Expenses
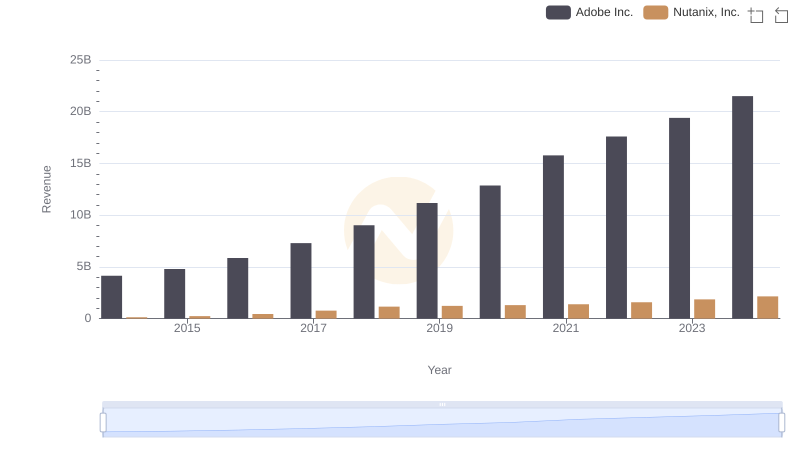
Adobe Inc. vs Nutanix, Inc.: Examining Key Revenue Metrics
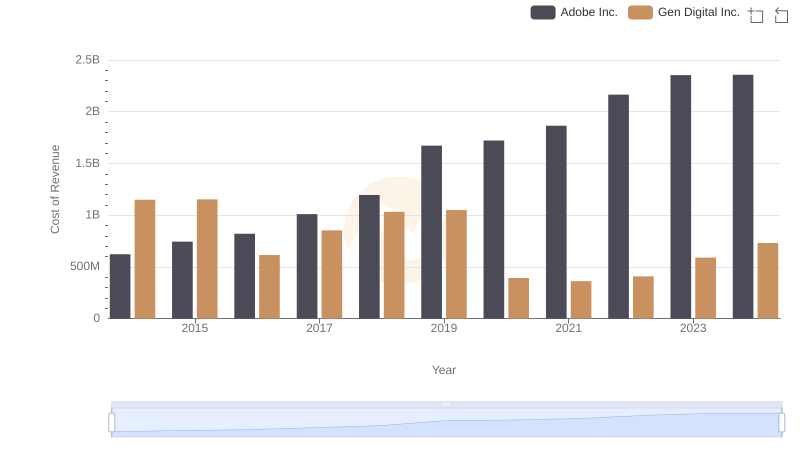
Cost of Revenue Trends: Adobe Inc. vs Gen Digital Inc.
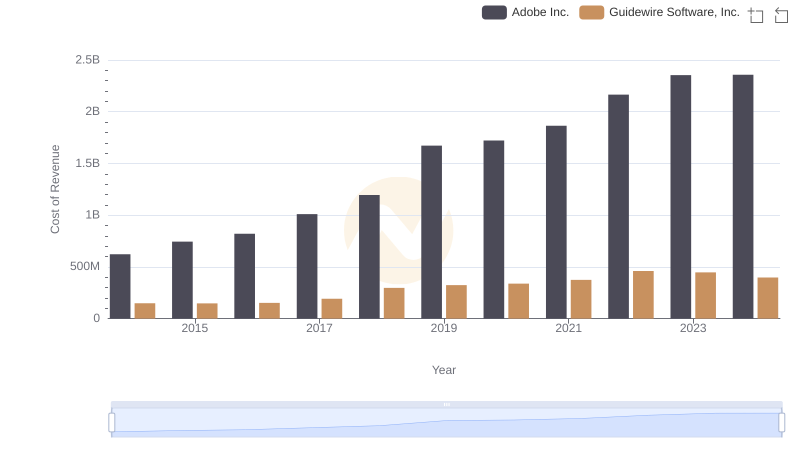
Cost Insights: Breaking Down Adobe Inc. and Guidewire Software, Inc.'s Expenses
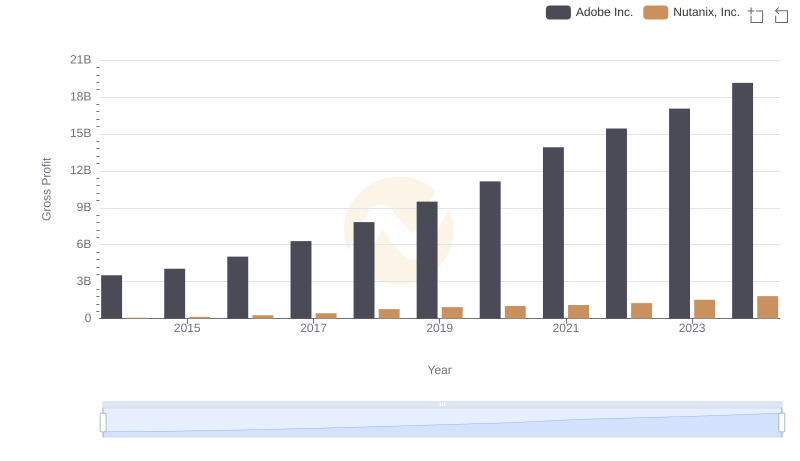
Adobe Inc. and Nutanix, Inc.: A Detailed Gross Profit Analysis
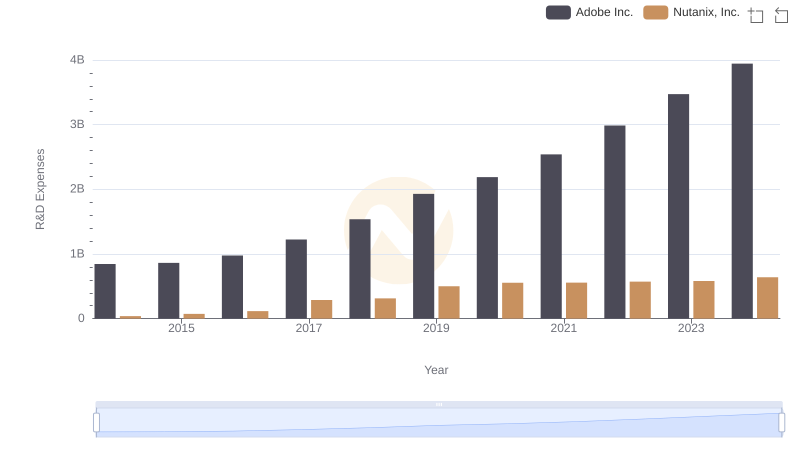
Analyzing R&D Budgets: Adobe Inc. vs Nutanix, Inc.
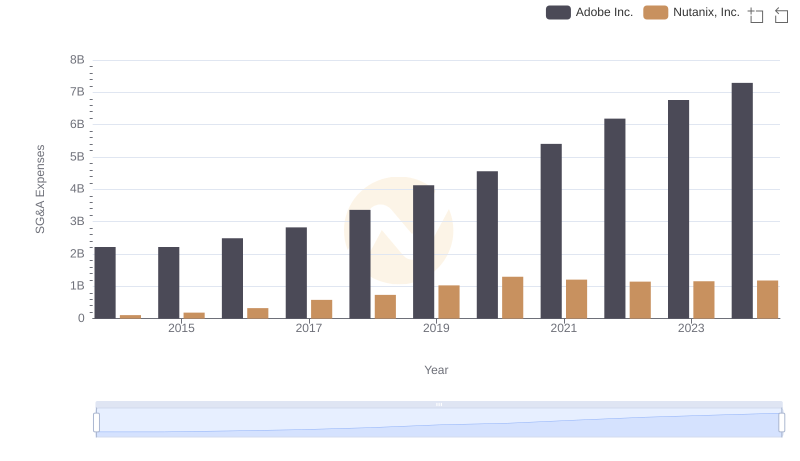
Cost Management Insights: SG&A Expenses for Adobe Inc. and Nutanix, Inc.