| __timestamp | Masco Corporation | Waste Management, Inc. |
|---|---|---|
| Wednesday, January 1, 2014 | 6134000000 | 9002000000 |
| Thursday, January 1, 2015 | 4889000000 | 8231000000 |
| Friday, January 1, 2016 | 4901000000 | 8486000000 |
| Sunday, January 1, 2017 | 5033000000 | 9021000000 |
| Monday, January 1, 2018 | 5670000000 | 9249000000 |
| Tuesday, January 1, 2019 | 4336000000 | 9496000000 |
| Wednesday, January 1, 2020 | 4601000000 | 9341000000 |
| Friday, January 1, 2021 | 5512000000 | 11111000000 |
| Saturday, January 1, 2022 | 5967000000 | 12294000000 |
| Sunday, January 1, 2023 | 5131000000 | 12606000000 |
| Monday, January 1, 2024 | 4997000000 | 13383000000 |
Unlocking the unknown
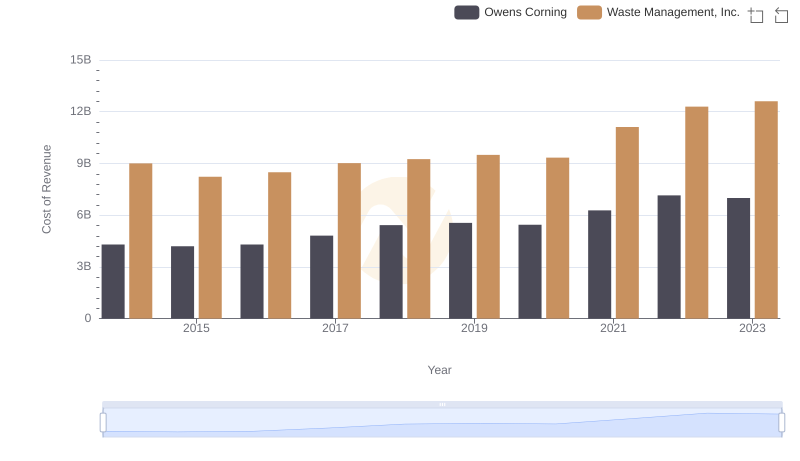
In the ever-evolving landscape of corporate expenses, understanding cost dynamics is crucial. Over the past decade, Waste Management, Inc. and Masco Corporation have showcased distinct trends in their cost of revenue. Waste Management, Inc. has seen a steady increase, with costs rising by approximately 40% from 2014 to 2023. This growth reflects the company's expanding operations and market presence. In contrast, Masco Corporation's cost of revenue has fluctuated, peaking in 2014 and 2022, but generally maintaining a more stable trajectory. By 2023, Masco's costs were about 16% lower than their 2014 peak. These insights highlight the differing strategies and market conditions faced by these industry giants. As businesses navigate the complexities of cost management, such analyses provide valuable perspectives on financial health and strategic direction.
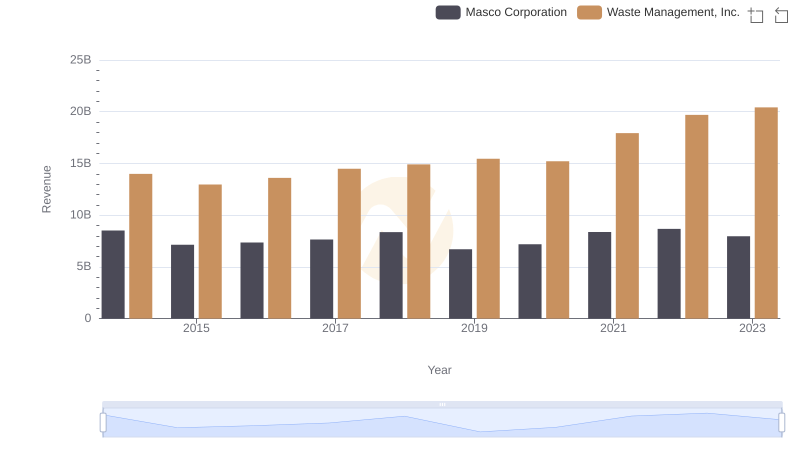
Revenue Showdown: Waste Management, Inc. vs Masco Corporation
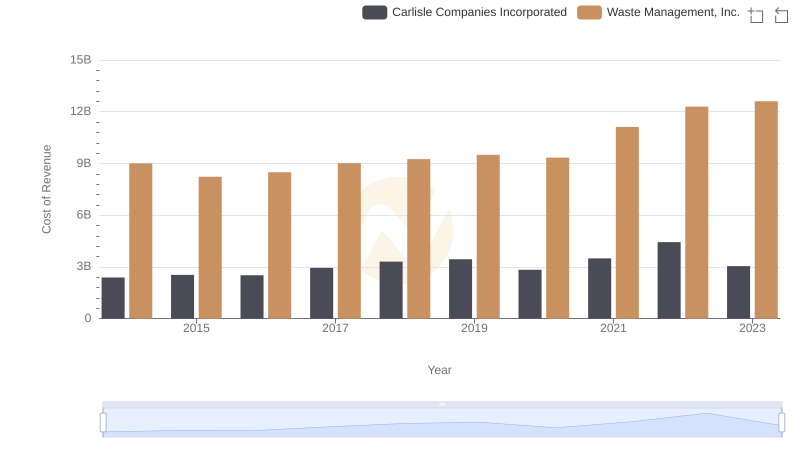
Waste Management, Inc. vs Carlisle Companies Incorporated: Efficiency in Cost of Revenue Explored
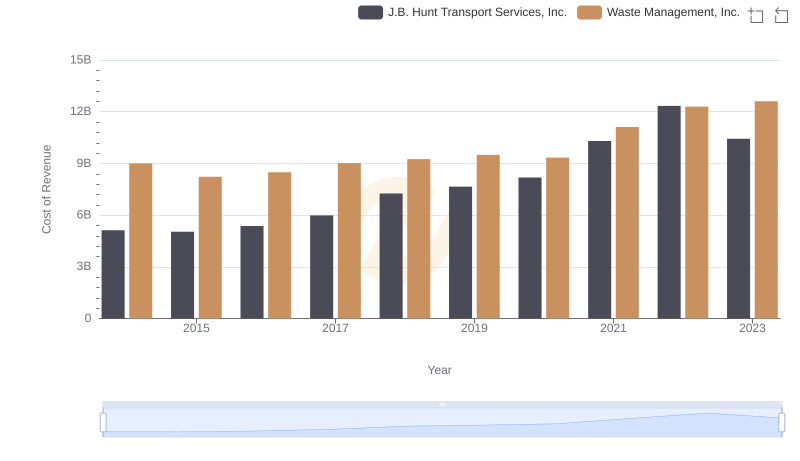
Cost of Revenue Trends: Waste Management, Inc. vs J.B. Hunt Transport Services, Inc.
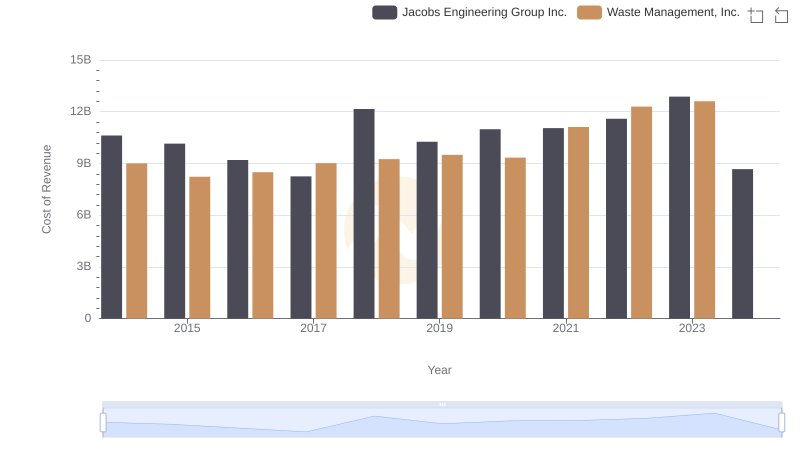
Cost of Revenue: Key Insights for Waste Management, Inc. and Jacobs Engineering Group Inc.
Comparing Cost of Revenue Efficiency: Waste Management, Inc. vs Owens Corning
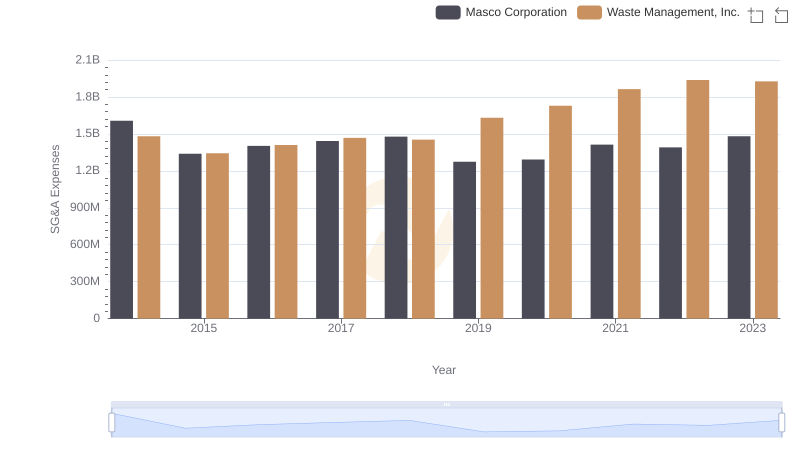
Selling, General, and Administrative Costs: Waste Management, Inc. vs Masco Corporation