| __timestamp | General Dynamics Corporation | Union Pacific Corporation |
|---|---|---|
| Wednesday, January 1, 2014 | 24979000000 | 14311000000 |
| Thursday, January 1, 2015 | 25339000000 | 12837000000 |
| Friday, January 1, 2016 | 25104000000 | 11672000000 |
| Sunday, January 1, 2017 | 24786000000 | 12231000000 |
| Monday, January 1, 2018 | 29478000000 | 13293000000 |
| Tuesday, January 1, 2019 | 32291000000 | 12094000000 |
| Wednesday, January 1, 2020 | 31600000000 | 10354000000 |
| Friday, January 1, 2021 | 32061000000 | 11290000000 |
| Saturday, January 1, 2022 | 32785000000 | 13670000000 |
| Sunday, January 1, 2023 | 35600000000 | 13590000000 |
| Monday, January 1, 2024 | 40352000000 | 13211000000 |
Data in motion
In the world of American industry, Union Pacific Corporation and General Dynamics Corporation stand as titans in their respective fields. From 2014 to 2023, these companies have showcased contrasting trends in their cost of revenue, a critical financial metric.
Union Pacific, a leader in the railroad industry, has seen a relatively stable cost of revenue over the years. Starting at approximately $14.3 billion in 2014, it experienced a slight dip to $10.4 billion in 2020, likely due to the pandemic's impact on transportation. However, by 2023, it rebounded to $13.6 billion, reflecting a resilient recovery.
Conversely, General Dynamics, a defense and aerospace powerhouse, has consistently increased its cost of revenue, peaking at $35.6 billion in 2023. This 42% rise from 2014 underscores its expanding operations and market demand.
The data for 2024 is incomplete, hinting at future developments in these industrial giants' financial landscapes.
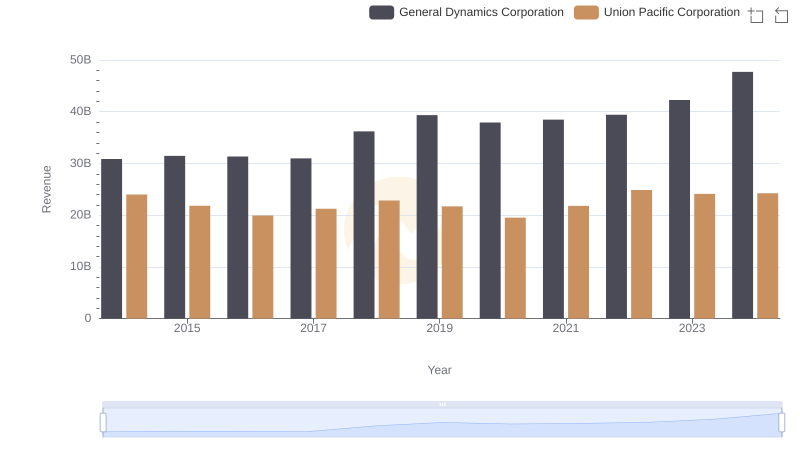
Revenue Showdown: Union Pacific Corporation vs General Dynamics Corporation
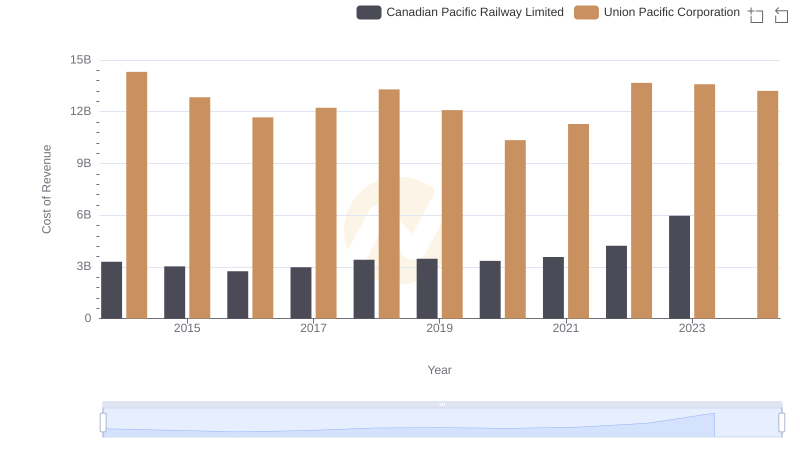
Analyzing Cost of Revenue: Union Pacific Corporation and Canadian Pacific Railway Limited
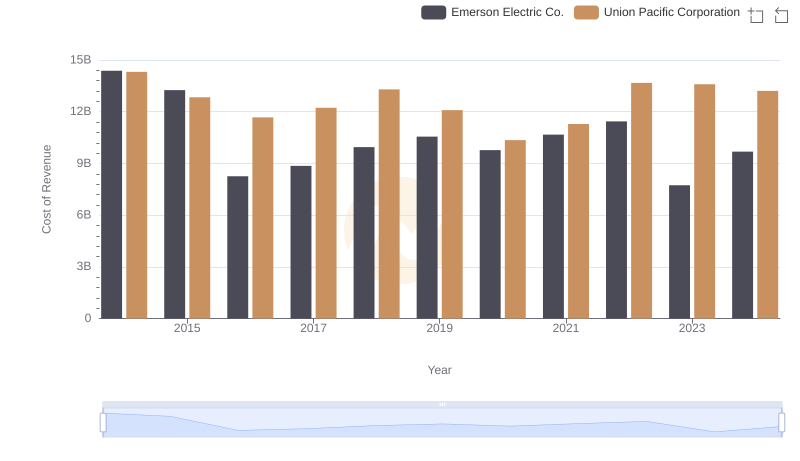
Cost of Revenue Trends: Union Pacific Corporation vs Emerson Electric Co.
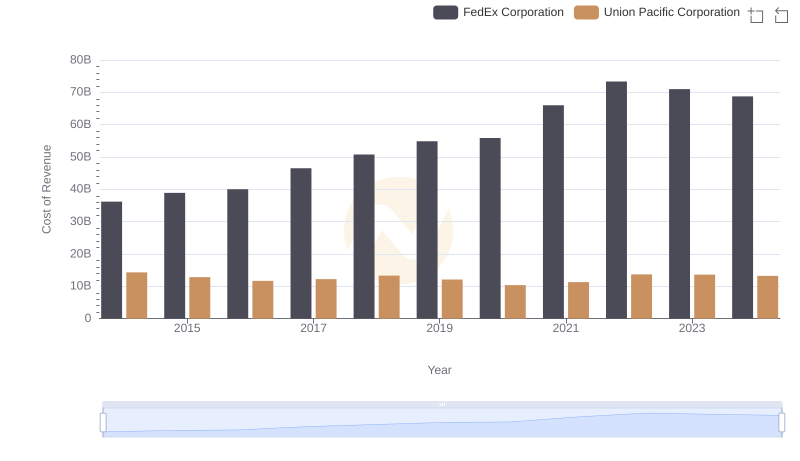
Union Pacific Corporation vs FedEx Corporation: Efficiency in Cost of Revenue Explored