| __timestamp | Ferguson plc | Ingersoll Rand Inc. |
|---|---|---|
| Wednesday, January 1, 2014 | 15995739428 | 1633224000 |
| Thursday, January 1, 2015 | 14984241894 | 1347800000 |
| Friday, January 1, 2016 | 13677144858 | 1222705000 |
| Sunday, January 1, 2017 | 14215866673 | 1477500000 |
| Monday, January 1, 2018 | 14708000000 | 1677300000 |
| Tuesday, January 1, 2019 | 15552000000 | 1540200000 |
| Wednesday, January 1, 2020 | 15398000000 | 3296800000 |
| Friday, January 1, 2021 | 15812000000 | 3163900000 |
| Saturday, January 1, 2022 | 19810000000 | 3590700000 |
| Sunday, January 1, 2023 | 20709000000 | 3993900000 |
| Monday, January 1, 2024 | 20582000000 | 0 |
Unleashing the power of data
In the ever-evolving landscape of industrial and building products, Ingersoll Rand Inc. and Ferguson plc stand as titans. Over the past decade, Ferguson plc has consistently outpaced Ingersoll Rand Inc. in terms of cost of revenue, with a staggering 800% higher average. From 2014 to 2023, Ferguson's cost of revenue surged by approximately 30%, peaking in 2023. In contrast, Ingersoll Rand Inc. saw a more modest increase of around 145% during the same period. Notably, 2020 marked a significant year for Ingersoll Rand Inc., with a dramatic rise in cost of revenue, nearly doubling from the previous year. This data highlights the dynamic nature of these industries and the strategic maneuvers companies must undertake to maintain their competitive edge. As we look to the future, the absence of data for 2024 for Ingersoll Rand Inc. leaves room for speculation and anticipation.
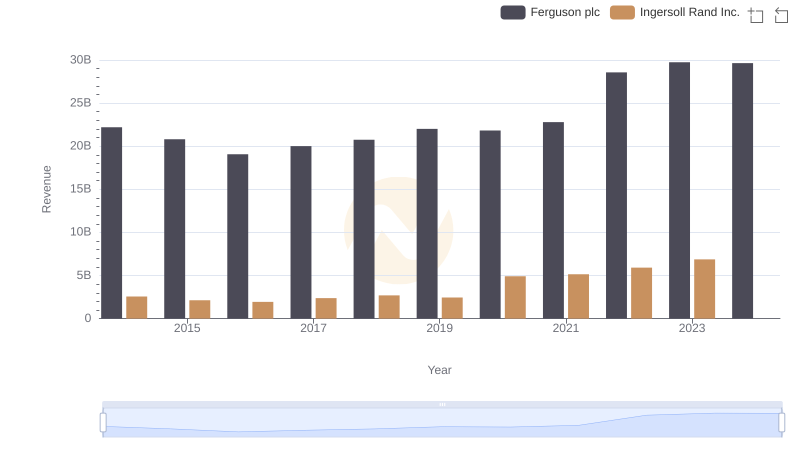
Ingersoll Rand Inc. vs Ferguson plc: Examining Key Revenue Metrics
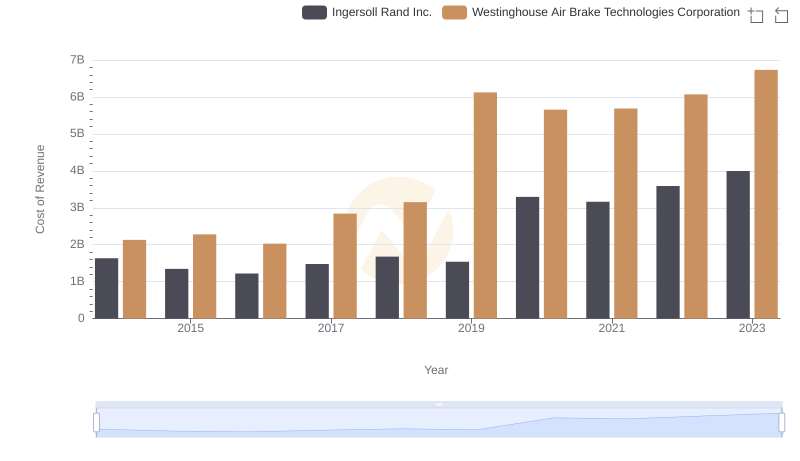
Cost of Revenue Comparison: Ingersoll Rand Inc. vs Westinghouse Air Brake Technologies Corporation
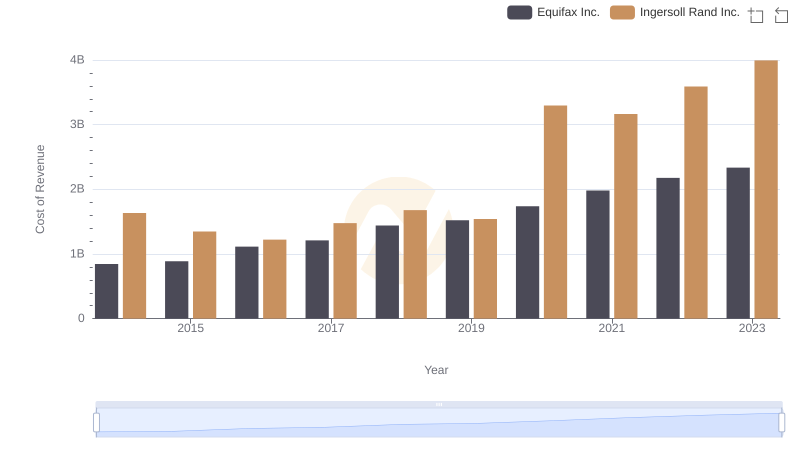
Cost of Revenue: Key Insights for Ingersoll Rand Inc. and Equifax Inc.
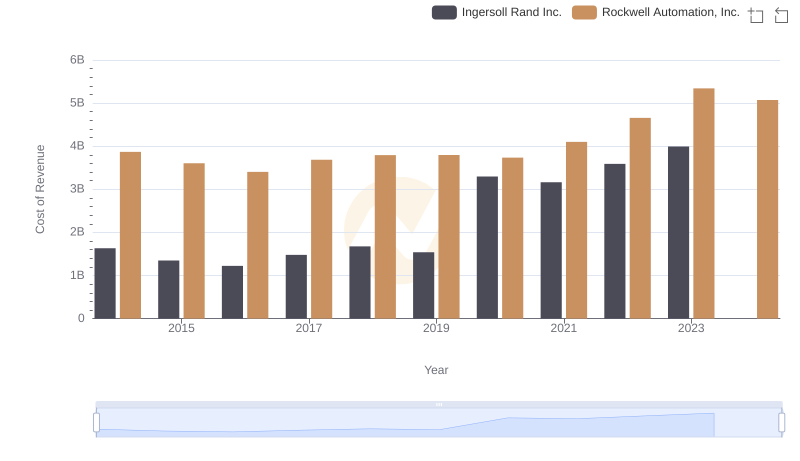
Cost of Revenue Trends: Ingersoll Rand Inc. vs Rockwell Automation, Inc.
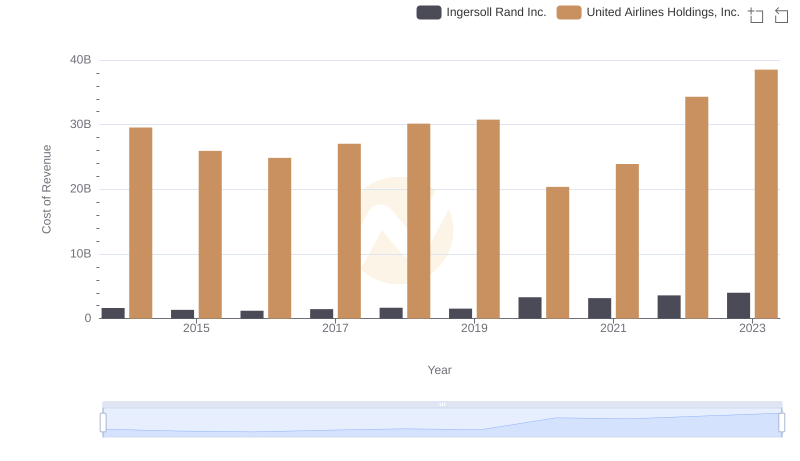
Cost Insights: Breaking Down Ingersoll Rand Inc. and United Airlines Holdings, Inc.'s Expenses
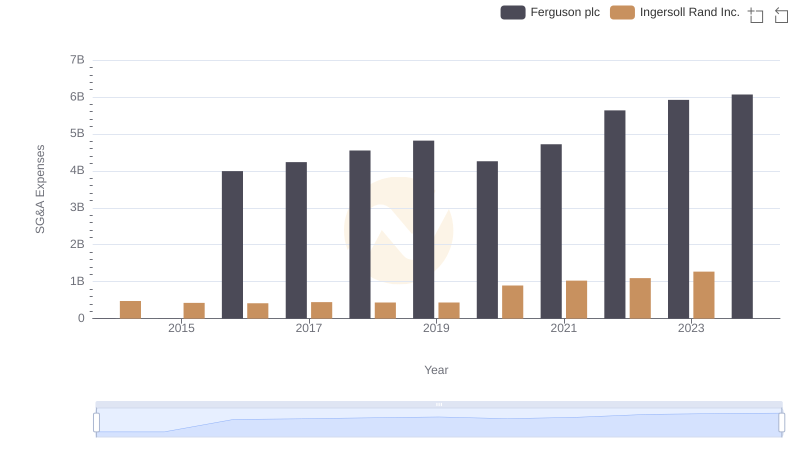
Operational Costs Compared: SG&A Analysis of Ingersoll Rand Inc. and Ferguson plc