| __timestamp | Eaton Corporation plc | Rentokil Initial plc |
|---|---|---|
| Wednesday, January 1, 2014 | 15646000000 | 297500000 |
| Thursday, January 1, 2015 | 14292000000 | 310200000 |
| Friday, January 1, 2016 | 13400000000 | 376100000 |
| Sunday, January 1, 2017 | 13756000000 | 474900000 |
| Monday, January 1, 2018 | 14511000000 | 514200000 |
| Tuesday, January 1, 2019 | 14338000000 | 2099000000 |
| Wednesday, January 1, 2020 | 12408000000 | 2136400000 |
| Friday, January 1, 2021 | 13293000000 | 2239100000 |
| Saturday, January 1, 2022 | 13865000000 | 2737000000 |
| Sunday, January 1, 2023 | 14763000000 | 927000000 |
| Monday, January 1, 2024 | 15375000000 |
Unveiling the hidden dimensions of data
In the ever-evolving landscape of global business, understanding cost structures is crucial for strategic decision-making. This analysis delves into the cost of revenue trends for Eaton Corporation plc and Rentokil Initial plc from 2014 to 2023. Over this period, Eaton Corporation's cost of revenue fluctuated, peaking in 2014 and showing a general decline of about 6% by 2020, before rebounding by 19% in 2023. Meanwhile, Rentokil Initial experienced a dramatic increase, with costs rising nearly tenfold from 2014 to 2022, before a significant drop in 2023. This data highlights the dynamic nature of operational costs and the importance of adaptive strategies in maintaining profitability. As businesses navigate these financial landscapes, understanding such trends can provide a competitive edge.
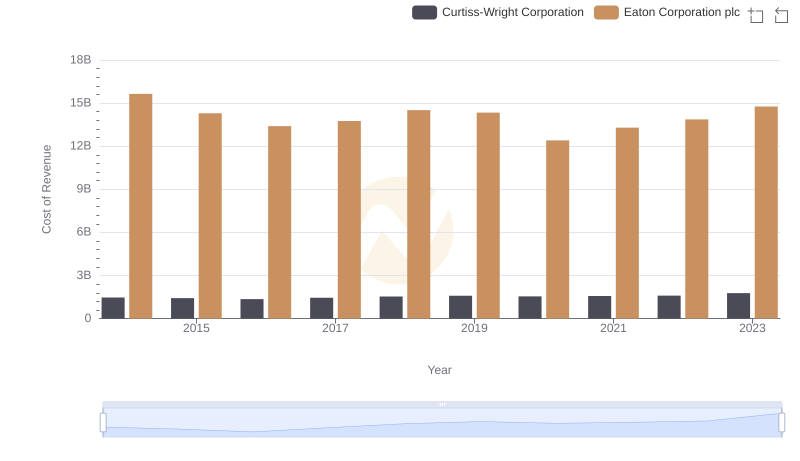
Cost of Revenue: Key Insights for Eaton Corporation plc and Curtiss-Wright Corporation

Cost of Revenue: Key Insights for Eaton Corporation plc and C.H. Robinson Worldwide, Inc.
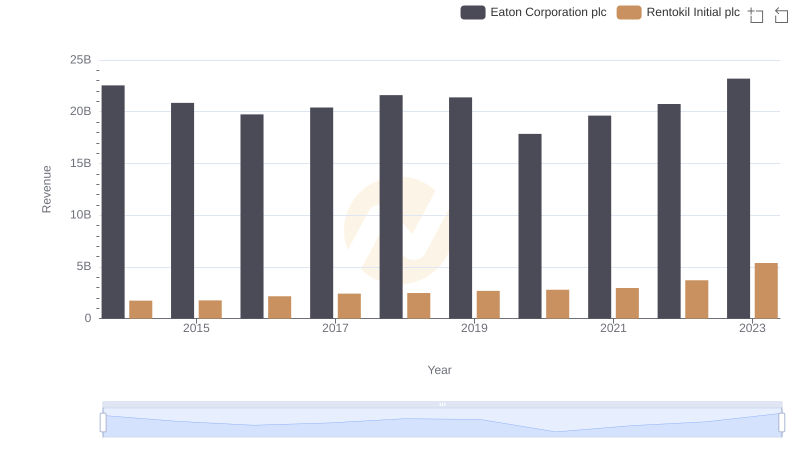
Eaton Corporation plc vs Rentokil Initial plc: Examining Key Revenue Metrics
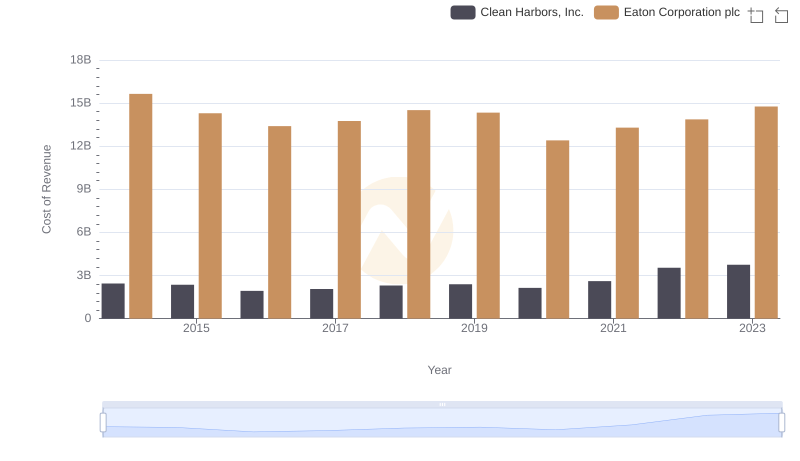
Eaton Corporation plc vs Clean Harbors, Inc.: Efficiency in Cost of Revenue Explored
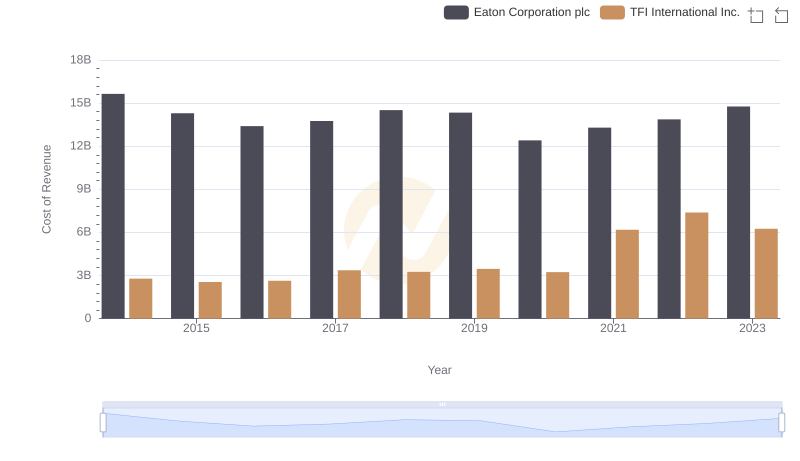
Cost of Revenue Trends: Eaton Corporation plc vs TFI International Inc.

Comparing SG&A Expenses: Eaton Corporation plc vs Rentokil Initial plc Trends and Insights