| __timestamp | C.H. Robinson Worldwide, Inc. | Eaton Corporation plc |
|---|---|---|
| Wednesday, January 1, 2014 | 12401436000 | 15646000000 |
| Thursday, January 1, 2015 | 12259014000 | 14292000000 |
| Friday, January 1, 2016 | 11931821000 | 13400000000 |
| Sunday, January 1, 2017 | 13680857000 | 13756000000 |
| Monday, January 1, 2018 | 15269479000 | 14511000000 |
| Tuesday, January 1, 2019 | 14021726000 | 14338000000 |
| Wednesday, January 1, 2020 | 15037716000 | 12408000000 |
| Friday, January 1, 2021 | 21493659000 | 13293000000 |
| Saturday, January 1, 2022 | 22826428000 | 13865000000 |
| Sunday, January 1, 2023 | 16457570000 | 14763000000 |
| Monday, January 1, 2024 | 16416191000 | 15375000000 |
In pursuit of knowledge
In the ever-evolving landscape of global commerce, understanding the cost of revenue is crucial for evaluating a company's financial health. This analysis focuses on Eaton Corporation plc and C.H. Robinson Worldwide, Inc., two giants in their respective industries. From 2014 to 2023, C.H. Robinson's cost of revenue fluctuated significantly, peaking in 2022 with a 64% increase from its 2014 figures. Meanwhile, Eaton Corporation maintained a more stable trajectory, with its cost of revenue showing a modest 6% decrease over the same period.
The data reveals that while C.H. Robinson experienced a dramatic rise in costs, Eaton's expenses remained relatively consistent, reflecting different operational strategies. Notably, 2024 data is missing, indicating potential reporting delays or strategic shifts. These insights provide a window into the financial strategies of these corporations, offering valuable lessons for investors and industry analysts alike.
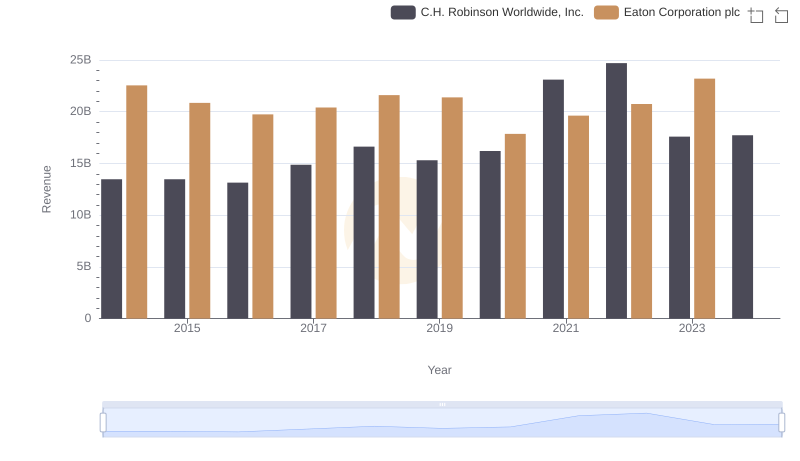
Breaking Down Revenue Trends: Eaton Corporation plc vs C.H. Robinson Worldwide, Inc.

Eaton Corporation plc vs Saia, Inc.: Efficiency in Cost of Revenue Explored
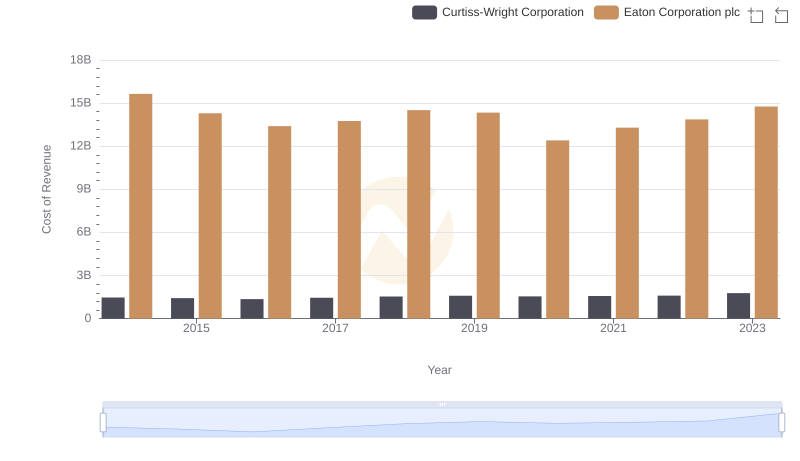
Cost of Revenue: Key Insights for Eaton Corporation plc and Curtiss-Wright Corporation
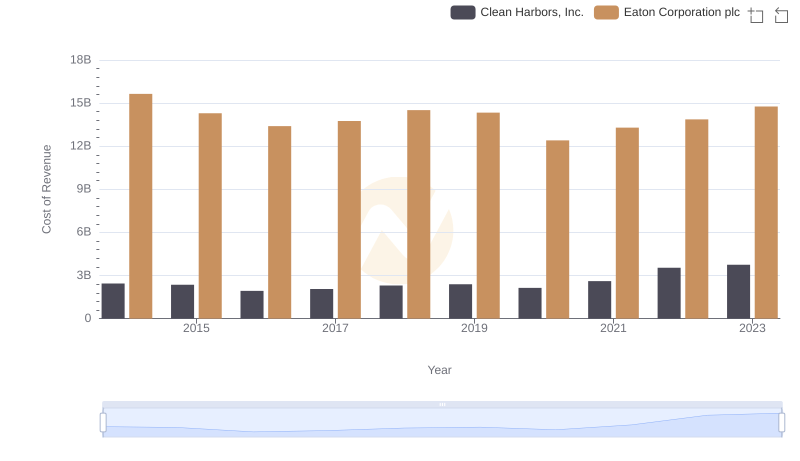
Eaton Corporation plc vs Clean Harbors, Inc.: Efficiency in Cost of Revenue Explored
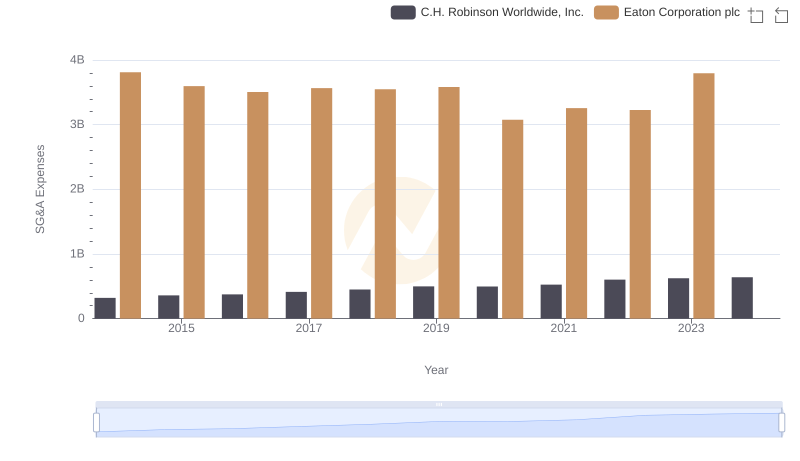
Cost Management Insights: SG&A Expenses for Eaton Corporation plc and C.H. Robinson Worldwide, Inc.
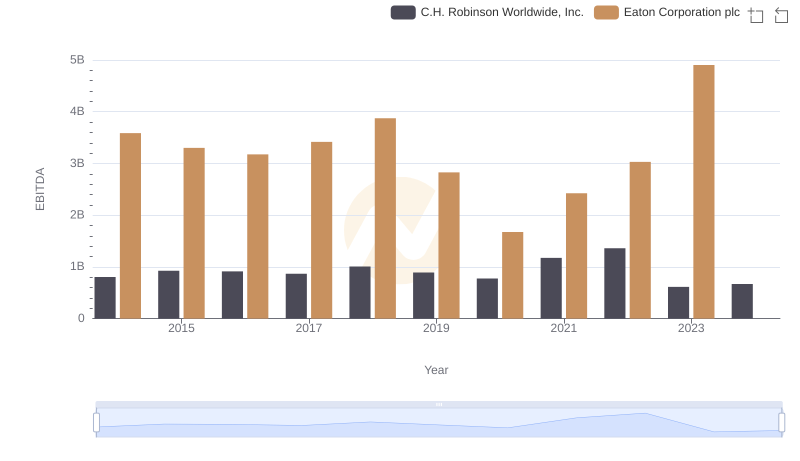
EBITDA Analysis: Evaluating Eaton Corporation plc Against C.H. Robinson Worldwide, Inc.