| __timestamp | Clean Harbors, Inc. | Eaton Corporation plc |
|---|---|---|
| Wednesday, January 1, 2014 | 2441796000 | 15646000000 |
| Thursday, January 1, 2015 | 2356806000 | 14292000000 |
| Friday, January 1, 2016 | 1932857000 | 13400000000 |
| Sunday, January 1, 2017 | 2062673000 | 13756000000 |
| Monday, January 1, 2018 | 2305551000 | 14511000000 |
| Tuesday, January 1, 2019 | 2387819000 | 14338000000 |
| Wednesday, January 1, 2020 | 2137751000 | 12408000000 |
| Friday, January 1, 2021 | 2609837000 | 13293000000 |
| Saturday, January 1, 2022 | 3543930000 | 13865000000 |
| Sunday, January 1, 2023 | 3746124000 | 14763000000 |
| Monday, January 1, 2024 | 4065713000 | 15375000000 |
Unlocking the unknown
In the ever-evolving landscape of industrial giants, understanding cost efficiency is paramount. This analysis delves into the cost of revenue trends for Eaton Corporation plc and Clean Harbors, Inc. from 2014 to 2023. Over this decade, Eaton Corporation consistently maintained a higher cost of revenue, peaking at approximately $14.8 billion in 2023. In contrast, Clean Harbors, Inc. showed a significant upward trend, with a 54% increase from 2014 to 2023, reaching nearly $3.7 billion.
This comparative analysis highlights the dynamic nature of cost management strategies in the industrial sector, offering valuable insights for investors and industry analysts.

Eaton Corporation plc vs Saia, Inc.: Efficiency in Cost of Revenue Explored
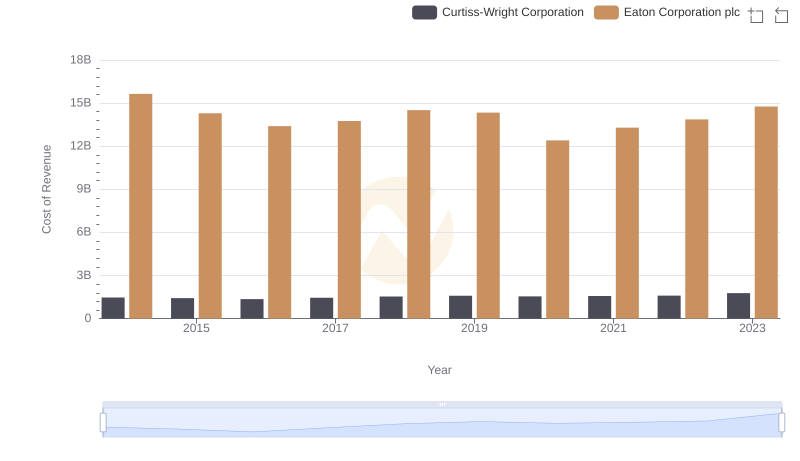
Cost of Revenue: Key Insights for Eaton Corporation plc and Curtiss-Wright Corporation

Cost of Revenue: Key Insights for Eaton Corporation plc and C.H. Robinson Worldwide, Inc.
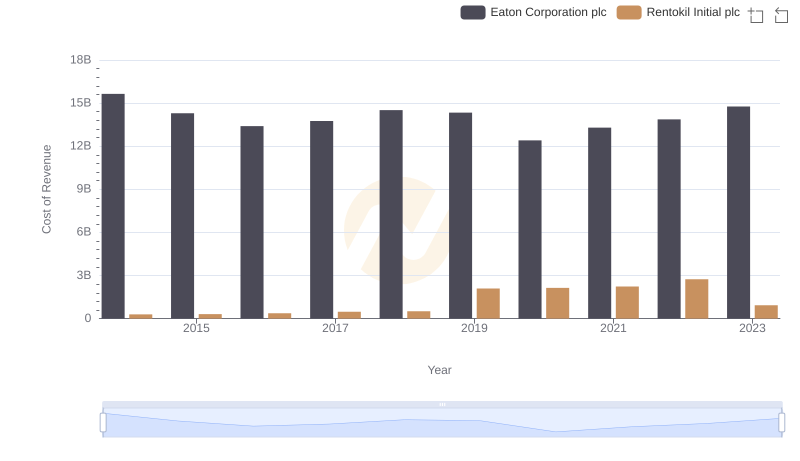
Cost of Revenue: Key Insights for Eaton Corporation plc and Rentokil Initial plc