| __timestamp | Eaton Corporation plc | TFI International Inc. |
|---|---|---|
| Wednesday, January 1, 2014 | 15646000000 | 2782605137 |
| Thursday, January 1, 2015 | 14292000000 | 2551474032 |
| Friday, January 1, 2016 | 13400000000 | 2636493564 |
| Sunday, January 1, 2017 | 13756000000 | 3364979721 |
| Monday, January 1, 2018 | 14511000000 | 3251443800 |
| Tuesday, January 1, 2019 | 14338000000 | 3461987950 |
| Wednesday, January 1, 2020 | 12408000000 | 3239249000 |
| Friday, January 1, 2021 | 13293000000 | 6182566000 |
| Saturday, January 1, 2022 | 13865000000 | 7385640000 |
| Sunday, January 1, 2023 | 14763000000 | 6255775000 |
| Monday, January 1, 2024 | 15375000000 |
Data in motion
In the ever-evolving landscape of industrial and logistics sectors, Eaton Corporation plc and TFI International Inc. have showcased intriguing cost of revenue trends over the past decade. Eaton, a leader in power management, saw its cost of revenue fluctuate, peaking in 2014 and experiencing a dip in 2020, likely due to global disruptions. However, it rebounded by 2023, marking a 19% increase from its lowest point. Meanwhile, TFI International, a major player in transportation and logistics, demonstrated a remarkable growth trajectory. From 2014 to 2022, TFI's cost of revenue surged by 165%, reflecting its aggressive expansion and acquisition strategy. This divergence highlights Eaton's steady resilience and TFI's dynamic growth, offering valuable insights into their strategic priorities. As these companies navigate future challenges, their cost management strategies will be pivotal in maintaining competitive edges.

Cost of Revenue: Key Insights for Eaton Corporation plc and C.H. Robinson Worldwide, Inc.
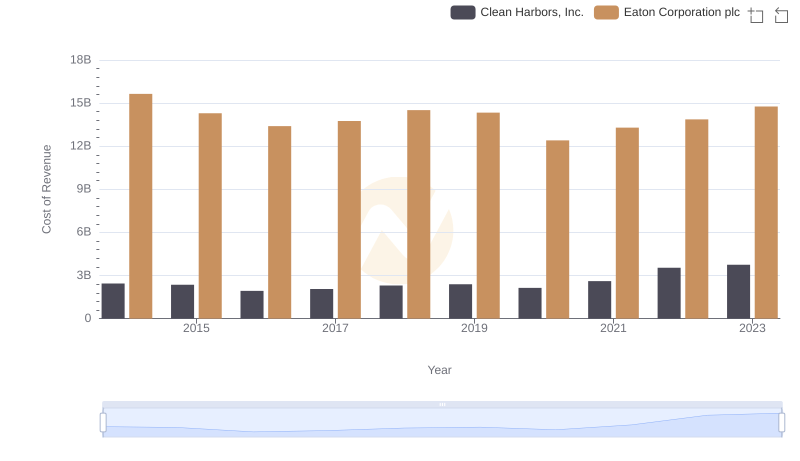
Eaton Corporation plc vs Clean Harbors, Inc.: Efficiency in Cost of Revenue Explored
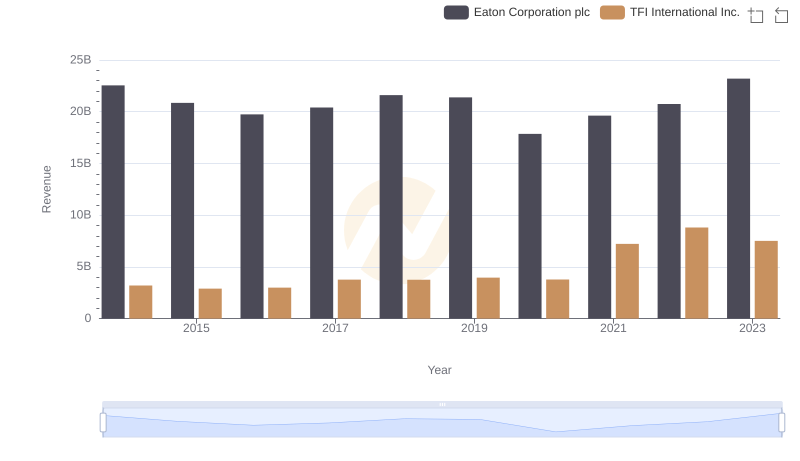
Eaton Corporation plc or TFI International Inc.: Who Leads in Yearly Revenue?
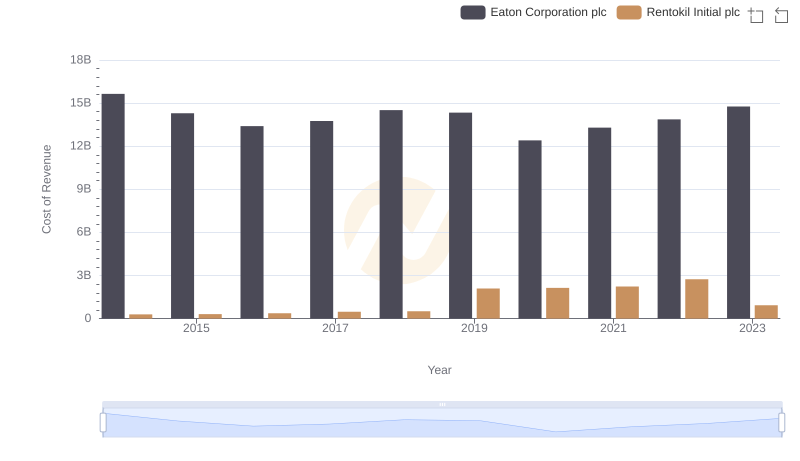
Cost of Revenue: Key Insights for Eaton Corporation plc and Rentokil Initial plc

Eaton Corporation plc and TFI International Inc.: A Detailed Gross Profit Analysis