| __timestamp | Curtiss-Wright Corporation | Eaton Corporation plc |
|---|---|---|
| Wednesday, January 1, 2014 | 1466610000 | 15646000000 |
| Thursday, January 1, 2015 | 1422428000 | 14292000000 |
| Friday, January 1, 2016 | 1358448000 | 13400000000 |
| Sunday, January 1, 2017 | 1452431000 | 13756000000 |
| Monday, January 1, 2018 | 1540574000 | 14511000000 |
| Tuesday, January 1, 2019 | 1589216000 | 14338000000 |
| Wednesday, January 1, 2020 | 1550109000 | 12408000000 |
| Friday, January 1, 2021 | 1572575000 | 13293000000 |
| Saturday, January 1, 2022 | 1602416000 | 13865000000 |
| Sunday, January 1, 2023 | 1778195000 | 14763000000 |
| Monday, January 1, 2024 | 1967640000 | 15375000000 |
Data in motion
In the ever-evolving landscape of industrial giants, Eaton Corporation plc and Curtiss-Wright Corporation have showcased intriguing cost management strategies over the past decade. From 2014 to 2023, Eaton's cost of revenue has seen a notable fluctuation, peaking in 2014 and 2023, with a dip in 2020, reflecting a 20% decrease from its highest point. This trend highlights Eaton's adaptive strategies in response to market dynamics and economic challenges.
Conversely, Curtiss-Wright has demonstrated a more consistent trajectory, with a steady increase in cost of revenue, culminating in a 21% rise from 2014 to 2023. This growth underscores Curtiss-Wright's expansion and investment in operational capabilities. The comparative analysis of these two corporations offers valuable insights into their financial health and strategic priorities, providing a window into the industrial sector's broader economic trends.
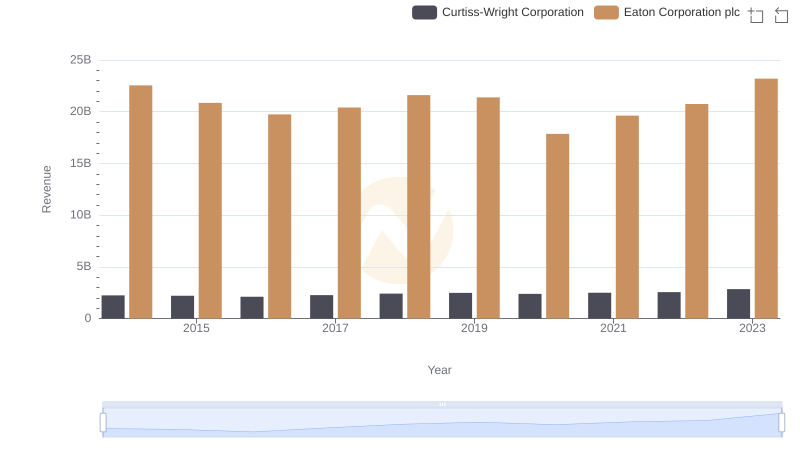
Eaton Corporation plc and Curtiss-Wright Corporation: A Comprehensive Revenue Analysis

Eaton Corporation plc vs Saia, Inc.: Efficiency in Cost of Revenue Explored

Cost of Revenue: Key Insights for Eaton Corporation plc and C.H. Robinson Worldwide, Inc.
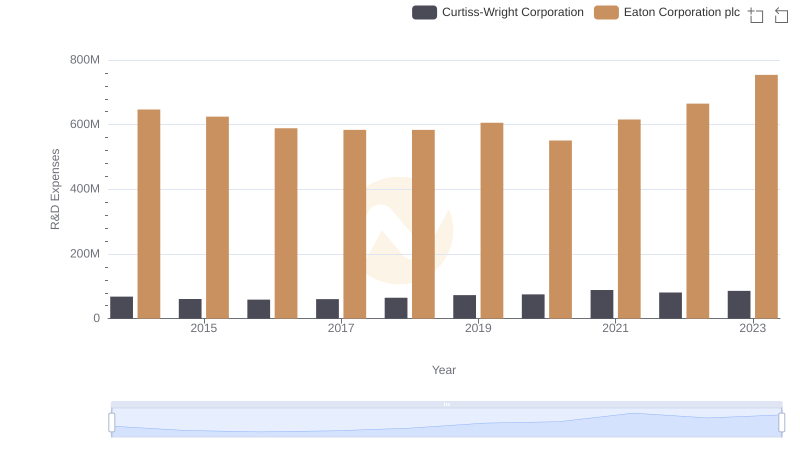
Eaton Corporation plc vs Curtiss-Wright Corporation: Strategic Focus on R&D Spending
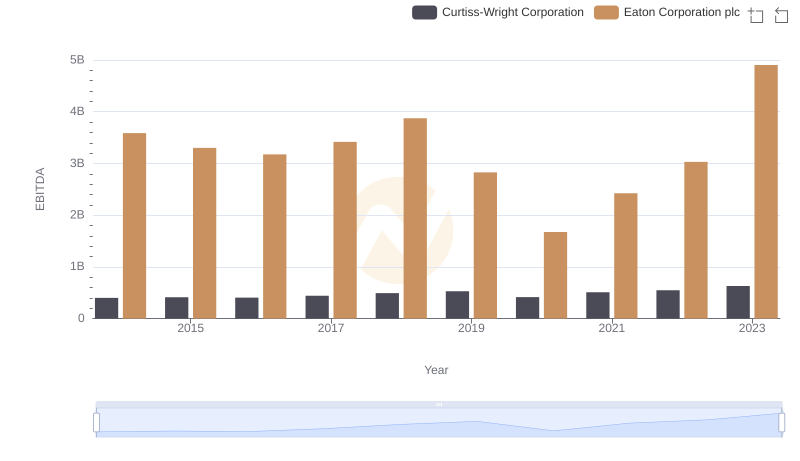
A Side-by-Side Analysis of EBITDA: Eaton Corporation plc and Curtiss-Wright Corporation