| __timestamp | Cisco Systems, Inc. | Electronic Arts Inc. |
|---|---|---|
| Wednesday, January 1, 2014 | 27769000000 | 2228000000 |
| Thursday, January 1, 2015 | 29681000000 | 3086000000 |
| Friday, January 1, 2016 | 30960000000 | 3042000000 |
| Sunday, January 1, 2017 | 30224000000 | 3547000000 |
| Monday, January 1, 2018 | 30606000000 | 3873000000 |
| Tuesday, January 1, 2019 | 32666000000 | 3628000000 |
| Wednesday, January 1, 2020 | 31683000000 | 4168000000 |
| Friday, January 1, 2021 | 31894000000 | 4135000000 |
| Saturday, January 1, 2022 | 32248000000 | 5132000000 |
| Sunday, January 1, 2023 | 35753000000 | 5634000000 |
| Monday, January 1, 2024 | 34828000000 | 5852000000 |
In pursuit of knowledge
In the ever-evolving landscape of technology and entertainment, Cisco Systems, Inc. and Electronic Arts Inc. have showcased intriguing gross profit trends over the past decade. From 2014 to 2024, Cisco's gross profit has seen a steady climb, peaking in 2023 with a remarkable 29% increase from its 2014 figures. Meanwhile, Electronic Arts has experienced a more dynamic growth trajectory, with a notable 163% rise in gross profit over the same period, reaching its zenith in 2024.
Cisco's consistent growth reflects its robust position in the tech industry, while Electronic Arts' impressive gains highlight the booming demand for digital entertainment. As we look to the future, these trends underscore the resilience and adaptability of both companies in their respective fields. This data not only provides a snapshot of past performance but also offers insights into potential future trajectories.
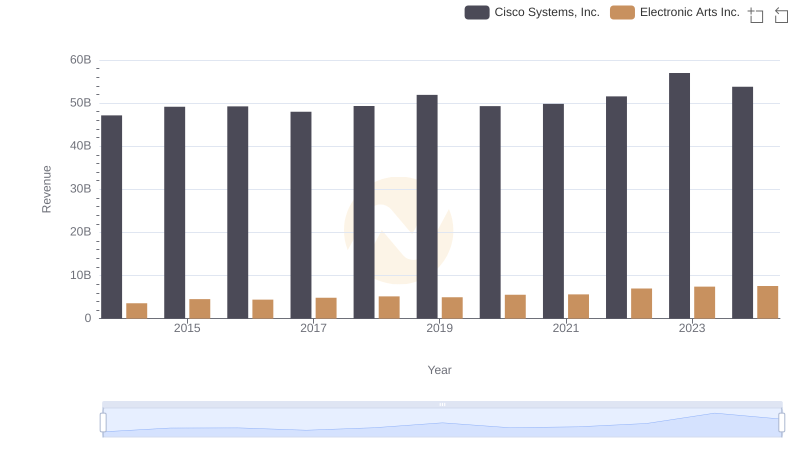
Cisco Systems, Inc. or Electronic Arts Inc.: Who Leads in Yearly Revenue?

Gross Profit Trends Compared: Cisco Systems, Inc. vs Garmin Ltd.
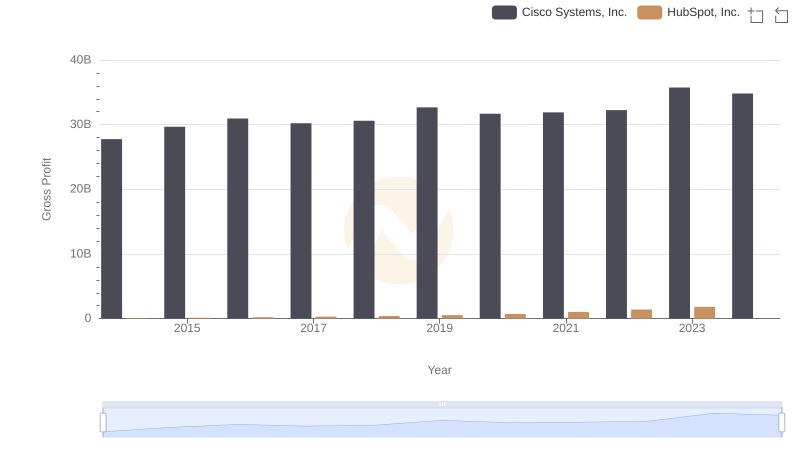
Who Generates Higher Gross Profit? Cisco Systems, Inc. or HubSpot, Inc.
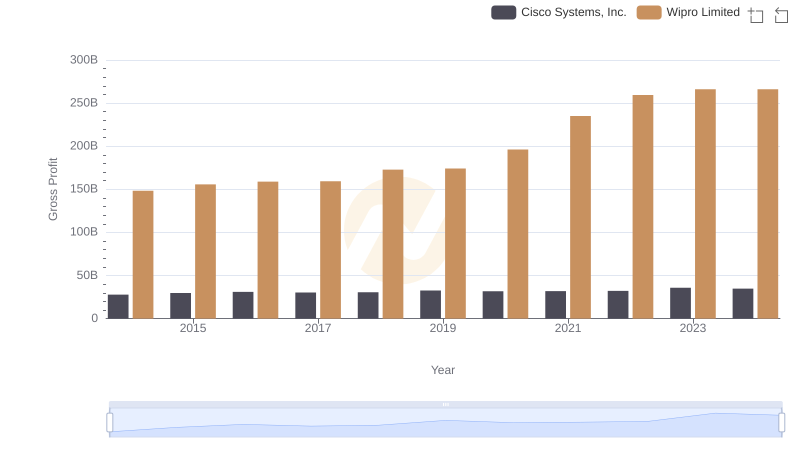
Gross Profit Analysis: Comparing Cisco Systems, Inc. and Wipro Limited
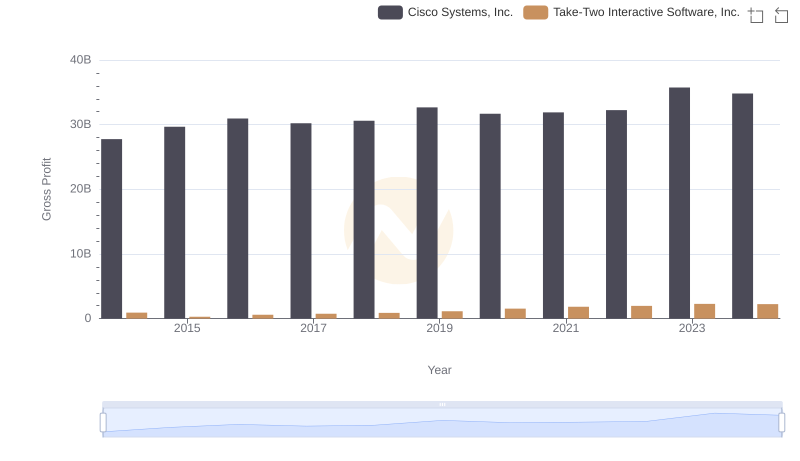
Key Insights on Gross Profit: Cisco Systems, Inc. vs Take-Two Interactive Software, Inc.
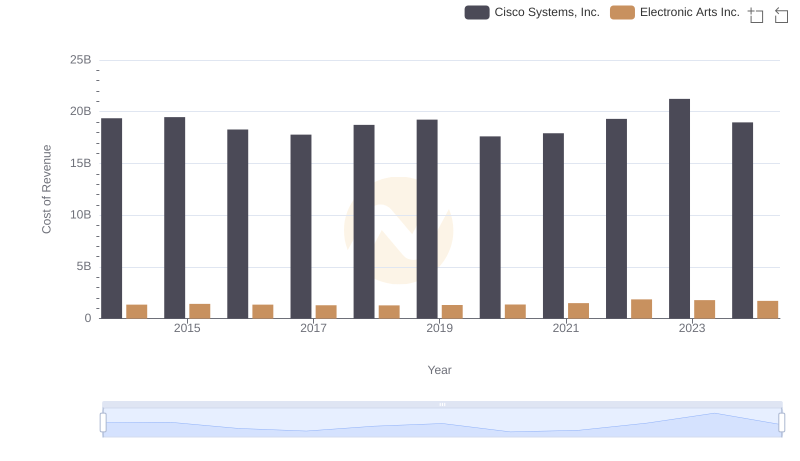
Cost of Revenue: Key Insights for Cisco Systems, Inc. and Electronic Arts Inc.

Gross Profit Analysis: Comparing Cisco Systems, Inc. and HP Inc.
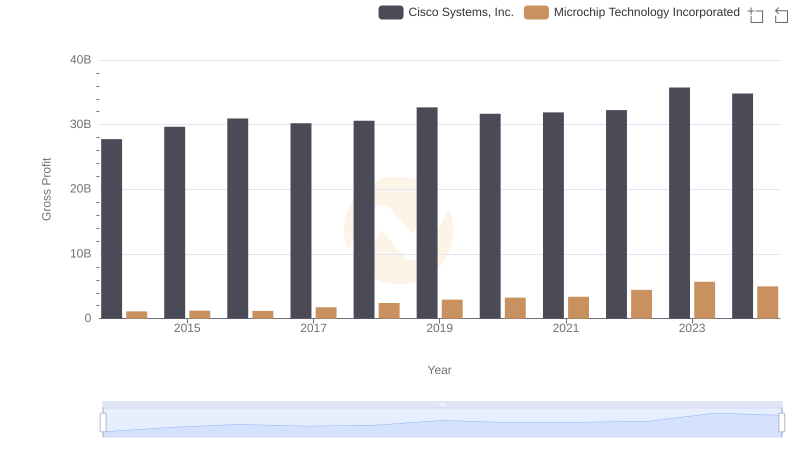
Cisco Systems, Inc. and Microchip Technology Incorporated: A Detailed Gross Profit Analysis
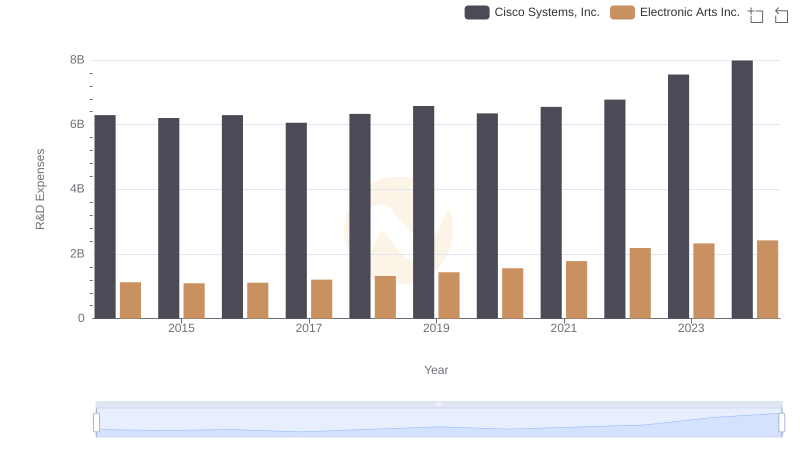
Who Prioritizes Innovation? R&D Spending Compared for Cisco Systems, Inc. and Electronic Arts Inc.
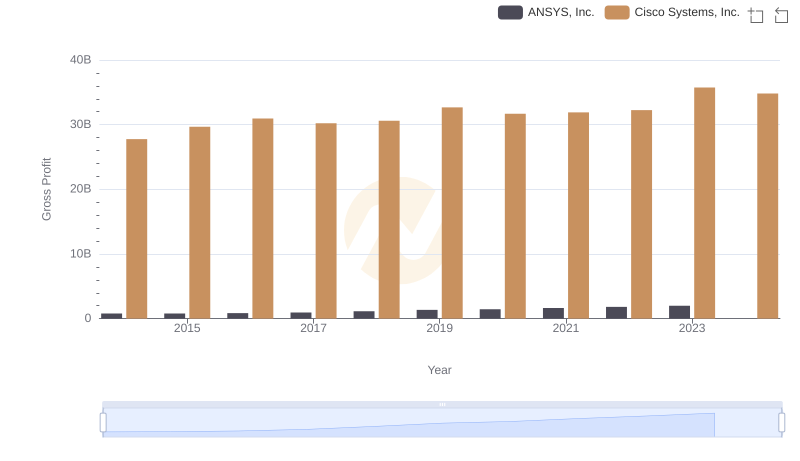
Key Insights on Gross Profit: Cisco Systems, Inc. vs ANSYS, Inc.
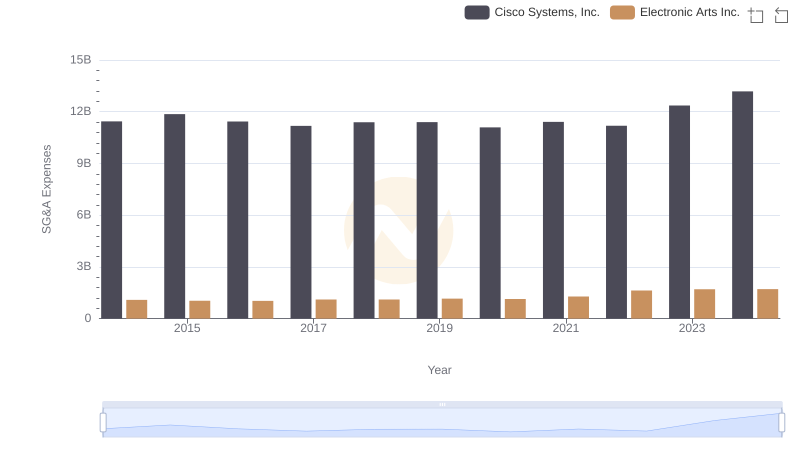
Who Optimizes SG&A Costs Better? Cisco Systems, Inc. or Electronic Arts Inc.
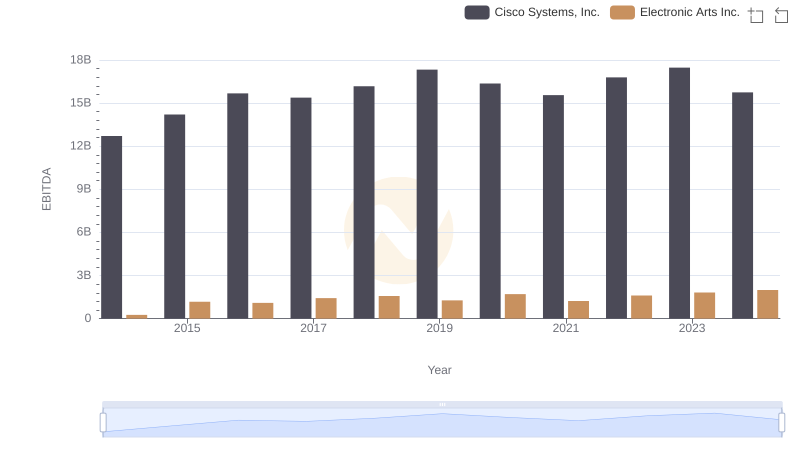
Professional EBITDA Benchmarking: Cisco Systems, Inc. vs Electronic Arts Inc.