| __timestamp | 3M Company | Ferguson plc |
|---|---|---|
| Wednesday, January 1, 2014 | 16447000000 | 15995739428 |
| Thursday, January 1, 2015 | 15383000000 | 14984241894 |
| Friday, January 1, 2016 | 15040000000 | 13677144858 |
| Sunday, January 1, 2017 | 16001000000 | 14215866673 |
| Monday, January 1, 2018 | 16682000000 | 14708000000 |
| Tuesday, January 1, 2019 | 17136000000 | 15552000000 |
| Wednesday, January 1, 2020 | 16605000000 | 15398000000 |
| Friday, January 1, 2021 | 18795000000 | 15812000000 |
| Saturday, January 1, 2022 | 19232000000 | 19810000000 |
| Sunday, January 1, 2023 | 18477000000 | 20709000000 |
| Monday, January 1, 2024 | 14447000000 | 20582000000 |
Unlocking the unknown
In the ever-evolving landscape of global business, understanding the cost of revenue is crucial for evaluating a company's financial health. This analysis delves into the cost of revenue trends for two industry giants: 3M Company and Ferguson plc, from 2014 to 2024.
Over the past decade, 3M Company has experienced a fluctuating cost of revenue, peaking in 2022 with a 17% increase from 2014. However, 2024 shows a significant drop, marking a 25% decrease from the previous year. In contrast, Ferguson plc has shown a steady upward trajectory, with a remarkable 29% rise in cost of revenue from 2014 to 2023, reflecting its expanding market presence.
These trends highlight the dynamic nature of cost management strategies in multinational corporations. As 3M navigates its cost challenges, Ferguson's consistent growth underscores its strategic prowess in the global market.

Cost of Revenue Comparison: 3M Company vs Ingersoll Rand Inc.
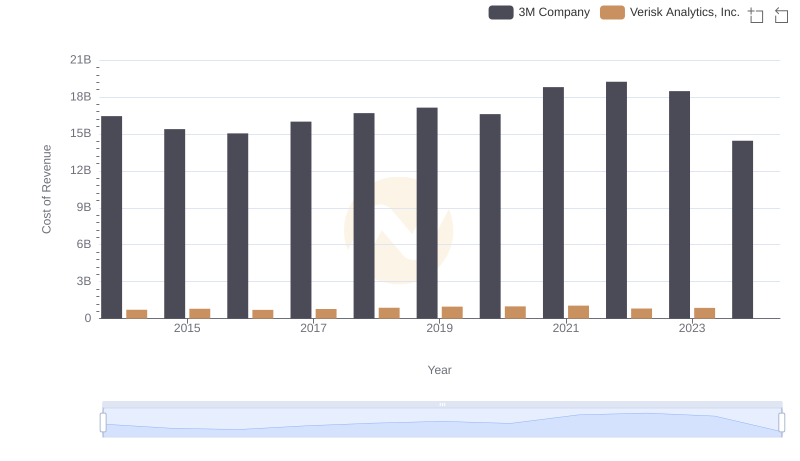
Cost Insights: Breaking Down 3M Company and Verisk Analytics, Inc.'s Expenses
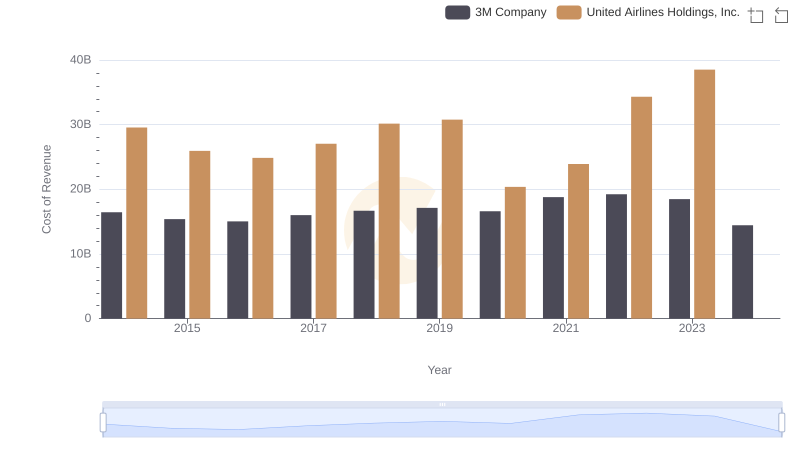
Cost Insights: Breaking Down 3M Company and United Airlines Holdings, Inc.'s Expenses
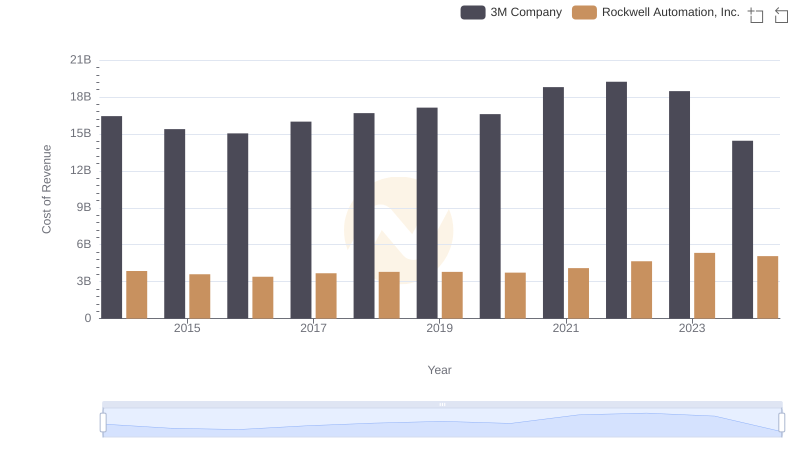
3M Company vs Rockwell Automation, Inc.: Efficiency in Cost of Revenue Explored
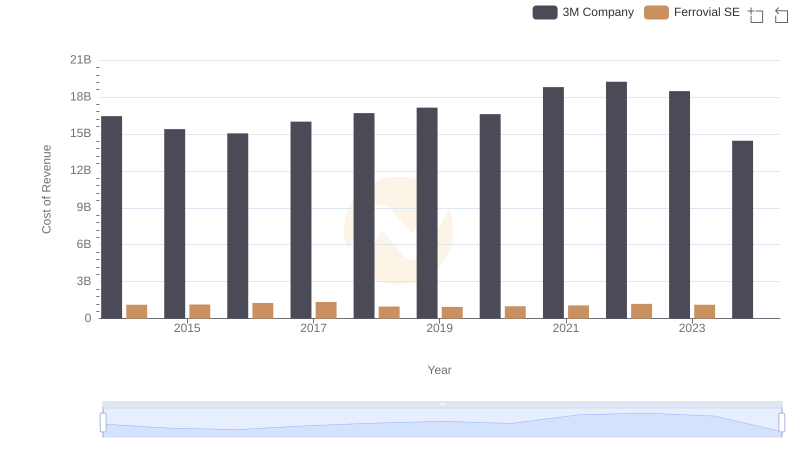
Cost of Revenue Trends: 3M Company vs Ferrovial SE
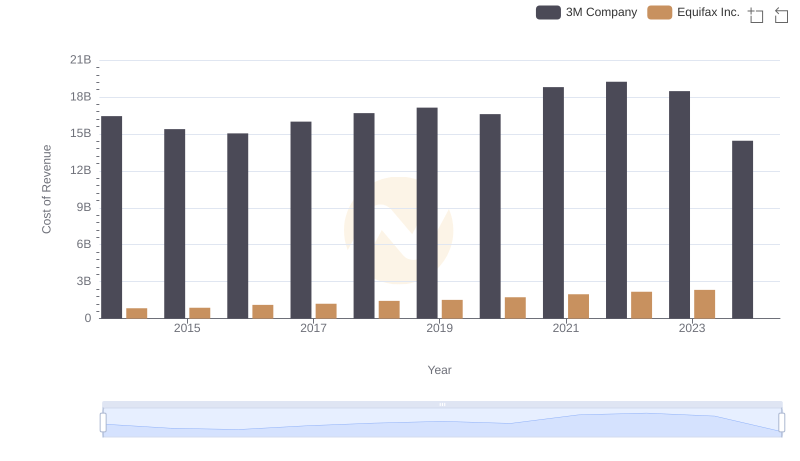
Cost of Revenue Comparison: 3M Company vs Equifax Inc.
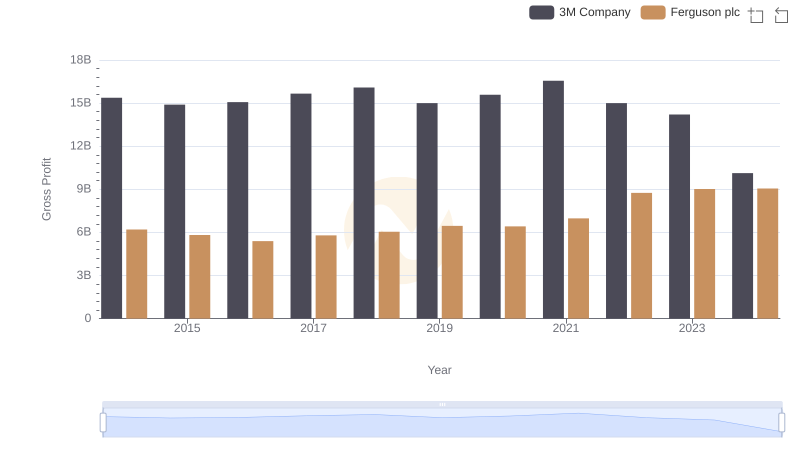
Gross Profit Trends Compared: 3M Company vs Ferguson plc
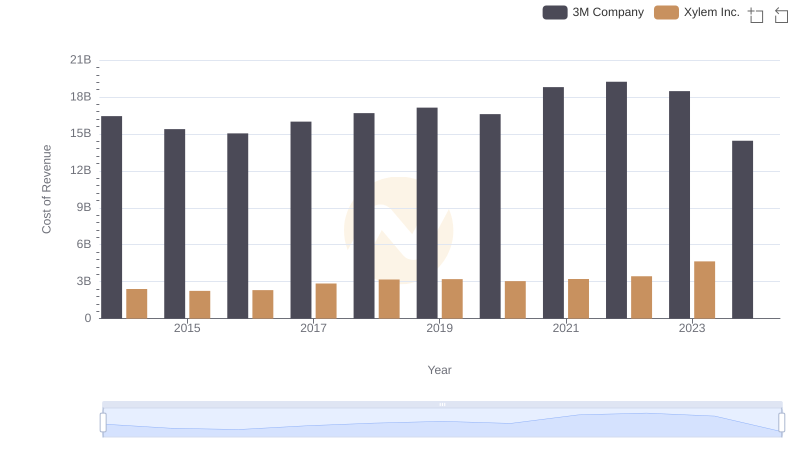
3M Company vs Xylem Inc.: Efficiency in Cost of Revenue Explored
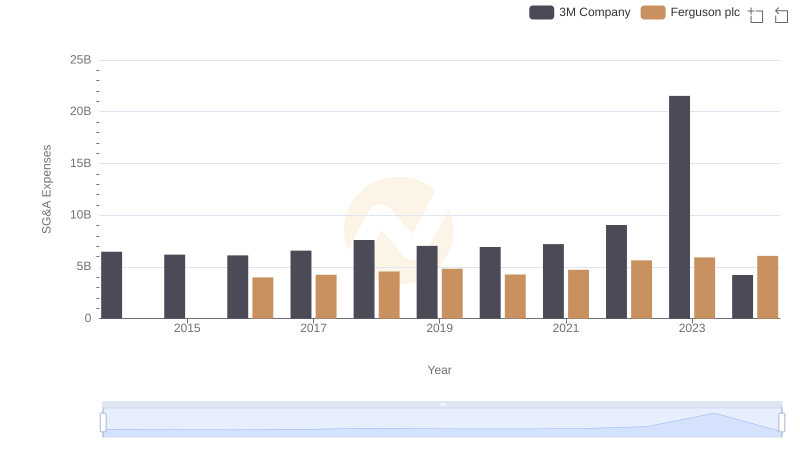
3M Company or Ferguson plc: Who Manages SG&A Costs Better?