| __timestamp | 3M Company | Verisk Analytics, Inc. |
|---|---|---|
| Wednesday, January 1, 2014 | 16447000000 | 716598000 |
| Thursday, January 1, 2015 | 15383000000 | 803274000 |
| Friday, January 1, 2016 | 15040000000 | 714400000 |
| Sunday, January 1, 2017 | 16001000000 | 783800000 |
| Monday, January 1, 2018 | 16682000000 | 886200000 |
| Tuesday, January 1, 2019 | 17136000000 | 976800000 |
| Wednesday, January 1, 2020 | 16605000000 | 993900000 |
| Friday, January 1, 2021 | 18795000000 | 1057800000 |
| Saturday, January 1, 2022 | 19232000000 | 824600000 |
| Sunday, January 1, 2023 | 18477000000 | 876500000 |
| Monday, January 1, 2024 | 14447000000 |
In pursuit of knowledge
In the ever-evolving landscape of corporate finance, understanding cost structures is pivotal. This analysis delves into the cost of revenue trends for two industry giants: 3M Company and Verisk Analytics, Inc., from 2014 to 2023.
3M's cost of revenue has seen a dynamic journey, peaking in 2022 with a 17% increase from 2014. However, 2024 data shows a significant drop, indicating potential strategic shifts or market challenges.
Verisk Analytics, Inc. has demonstrated a consistent upward trend, with a notable 48% increase in cost of revenue from 2014 to 2021. Despite a dip in 2022, the company rebounded in 2023, reflecting resilience and adaptability.
This comparative insight not only highlights the financial strategies of these companies but also offers a lens into their operational efficiencies and market positioning.
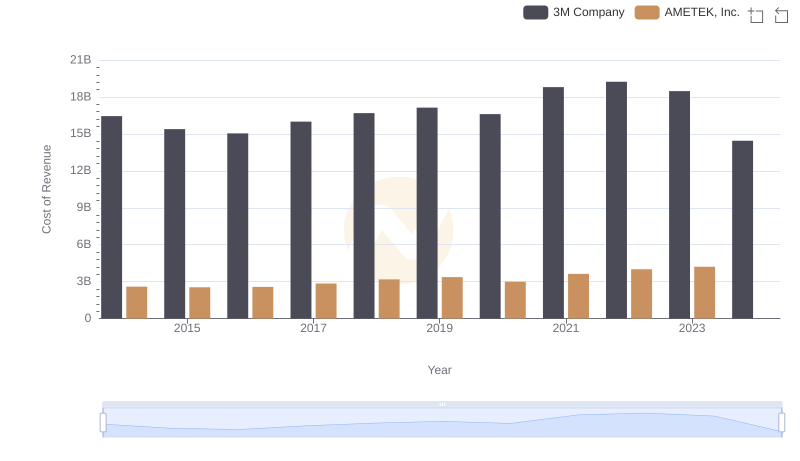
Cost of Revenue Comparison: 3M Company vs AMETEK, Inc.
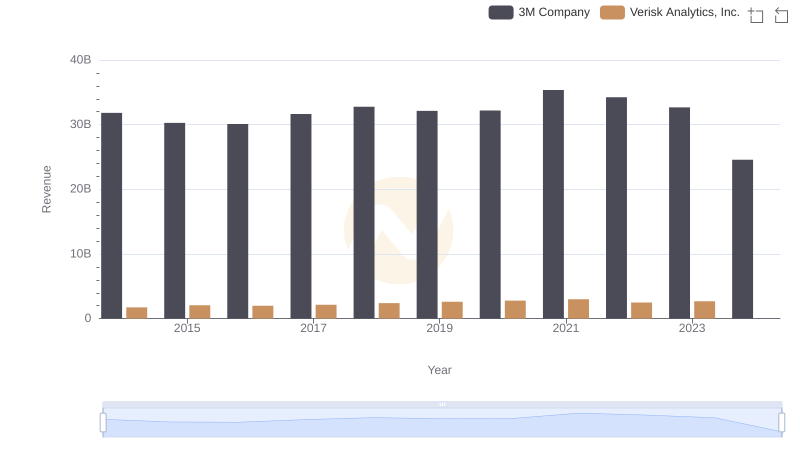
Annual Revenue Comparison: 3M Company vs Verisk Analytics, Inc.

Cost of Revenue Comparison: 3M Company vs Ingersoll Rand Inc.
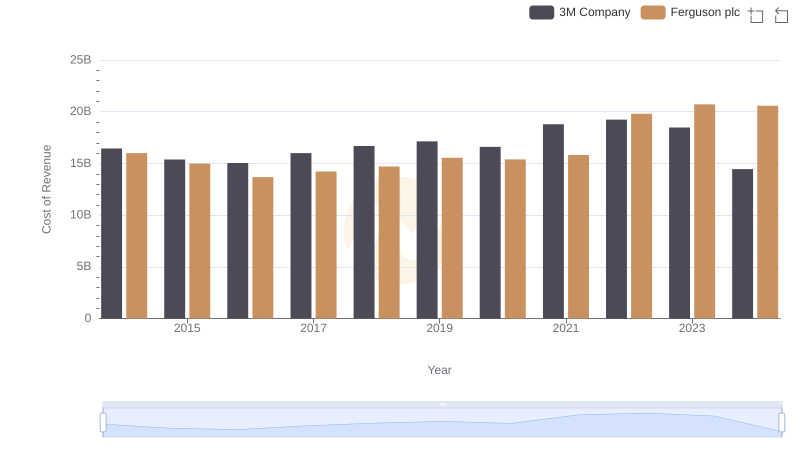
Cost of Revenue: Key Insights for 3M Company and Ferguson plc
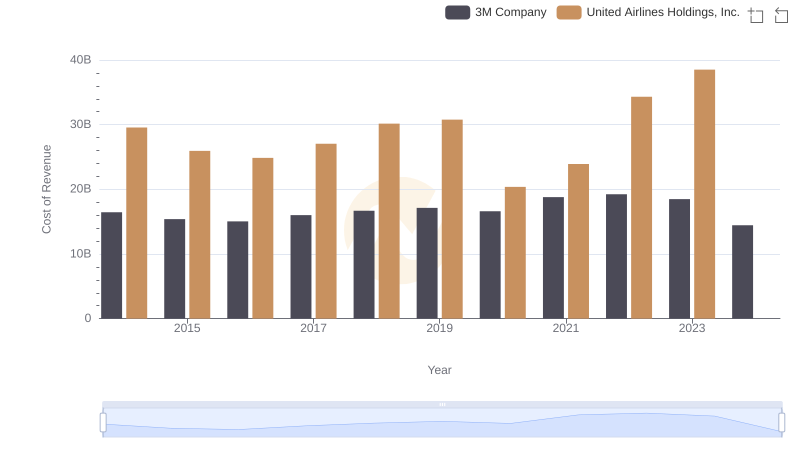
Cost Insights: Breaking Down 3M Company and United Airlines Holdings, Inc.'s Expenses
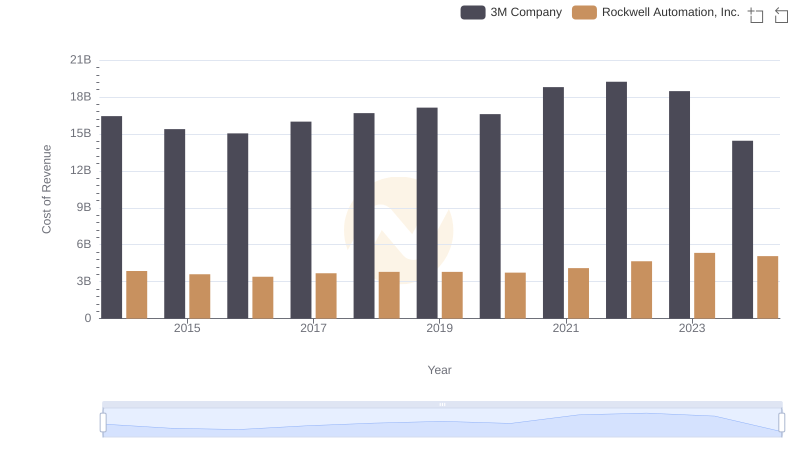
3M Company vs Rockwell Automation, Inc.: Efficiency in Cost of Revenue Explored
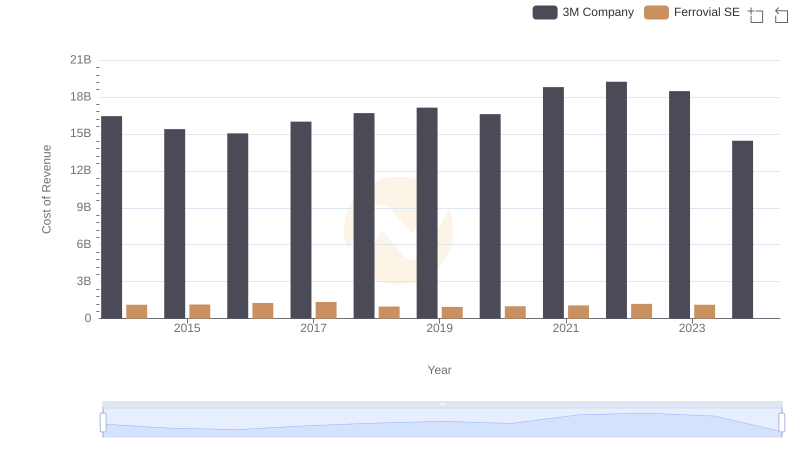
Cost of Revenue Trends: 3M Company vs Ferrovial SE
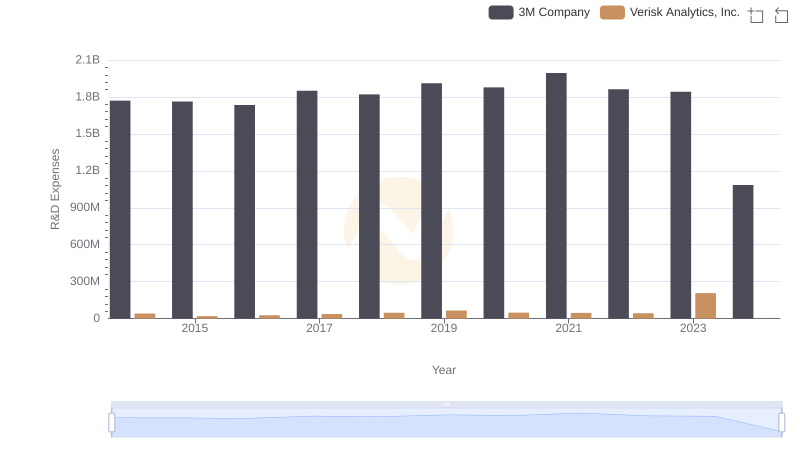
Research and Development Expenses Breakdown: 3M Company vs Verisk Analytics, Inc.
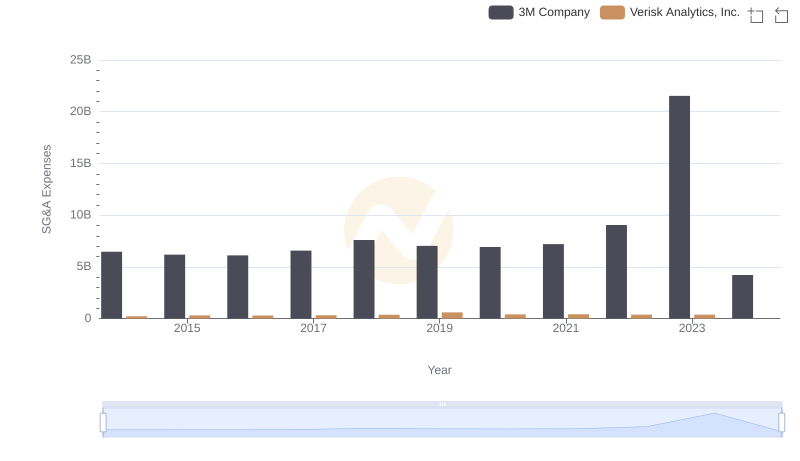
Selling, General, and Administrative Costs: 3M Company vs Verisk Analytics, Inc.