| __timestamp | Ferguson plc | Waste Connections, Inc. |
|---|---|---|
| Wednesday, January 1, 2014 | 15995739428 | 1138388000 |
| Thursday, January 1, 2015 | 14984241894 | 1177409000 |
| Friday, January 1, 2016 | 13677144858 | 1957712000 |
| Sunday, January 1, 2017 | 14215866673 | 2704775000 |
| Monday, January 1, 2018 | 14708000000 | 2865704000 |
| Tuesday, January 1, 2019 | 15552000000 | 3198757000 |
| Wednesday, January 1, 2020 | 15398000000 | 3276808000 |
| Friday, January 1, 2021 | 15812000000 | 3654074000 |
| Saturday, January 1, 2022 | 19810000000 | 4336012000 |
| Sunday, January 1, 2023 | 20709000000 | 4744513000 |
| Monday, January 1, 2024 | 20582000000 | 5191706000 |
Unveiling the hidden dimensions of data
In the ever-evolving landscape of global business, Waste Connections, Inc. and Ferguson plc stand as titans in their respective industries. Over the past decade, Ferguson plc has consistently outpaced Waste Connections, Inc. in terms of cost of revenue, with figures peaking at approximately $20.7 billion in 2023, a 30% increase from 2014. Meanwhile, Waste Connections, Inc. has shown a robust growth trajectory, with its cost of revenue rising by over 300% from 2014 to 2023, reaching nearly $4.7 billion. This stark contrast highlights the diverse operational scales and market strategies of these two companies. While Ferguson plc's cost of revenue reflects its expansive global reach, Waste Connections, Inc.'s growth underscores its strategic focus on efficiency and market penetration. As we look to the future, the absence of data for Waste Connections, Inc. in 2024 leaves room for speculation on its next strategic move.
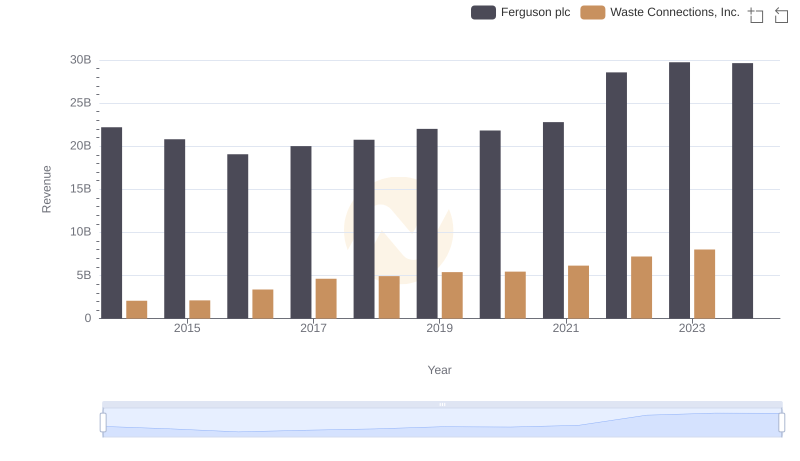
Comparing Revenue Performance: Waste Connections, Inc. or Ferguson plc?
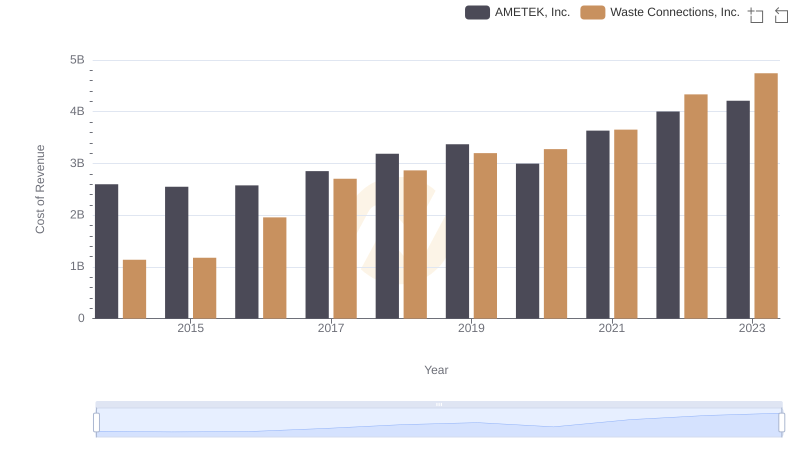
Cost of Revenue: Key Insights for Waste Connections, Inc. and AMETEK, Inc.
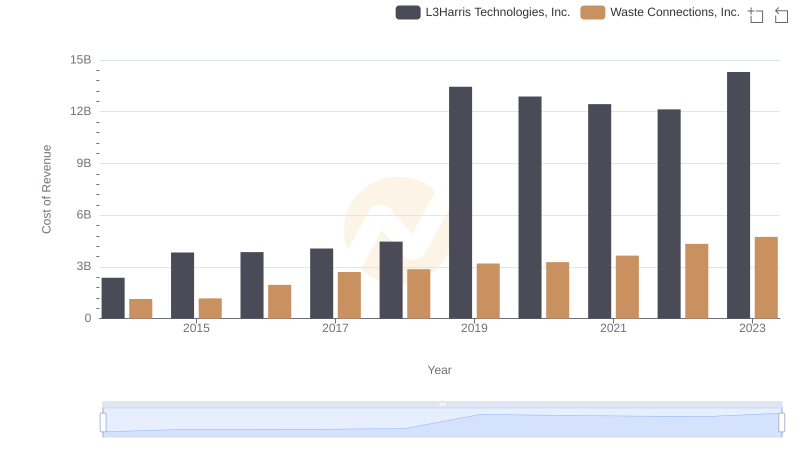
Cost of Revenue: Key Insights for Waste Connections, Inc. and L3Harris Technologies, Inc.
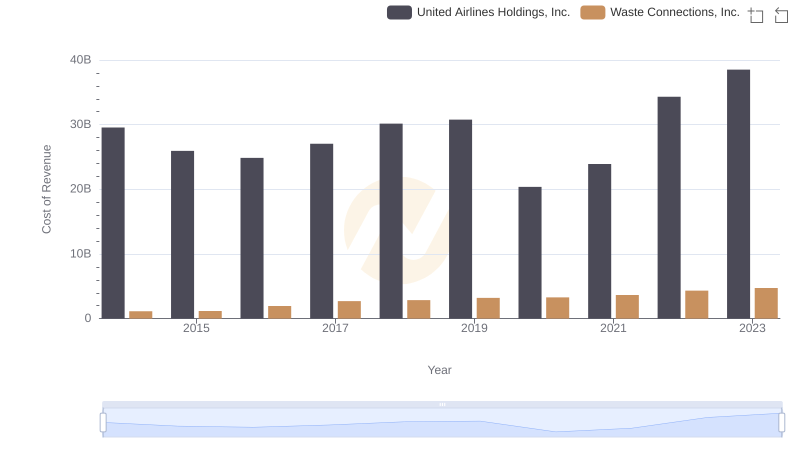
Cost of Revenue Comparison: Waste Connections, Inc. vs United Airlines Holdings, Inc.
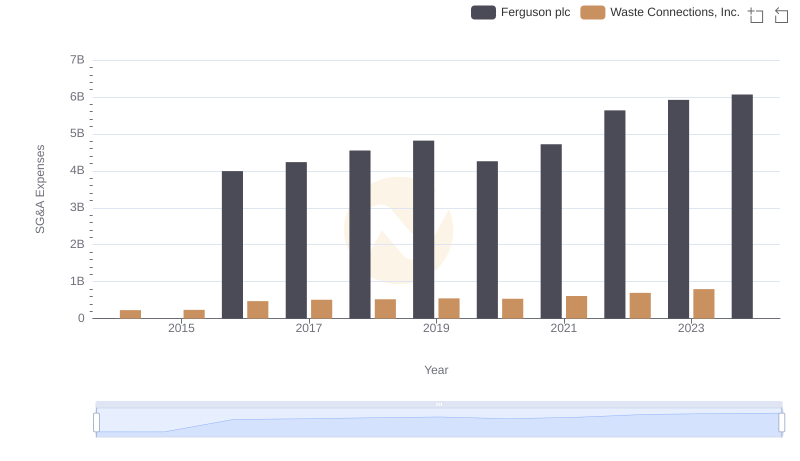
Waste Connections, Inc. or Ferguson plc: Who Manages SG&A Costs Better?

EBITDA Metrics Evaluated: Waste Connections, Inc. vs Ferguson plc