| __timestamp | L3Harris Technologies, Inc. | Parker-Hannifin Corporation |
|---|---|---|
| Wednesday, January 1, 2014 | 2370000000 | 10188227000 |
| Thursday, January 1, 2015 | 3832000000 | 9655245000 |
| Friday, January 1, 2016 | 3854000000 | 8823384000 |
| Sunday, January 1, 2017 | 4066000000 | 9188962000 |
| Monday, January 1, 2018 | 4467000000 | 10762841000 |
| Tuesday, January 1, 2019 | 13452000000 | 10703484000 |
| Wednesday, January 1, 2020 | 12886000000 | 10286518000 |
| Friday, January 1, 2021 | 12438000000 | 10449680000 |
| Saturday, January 1, 2022 | 12135000000 | 11387267000 |
| Sunday, January 1, 2023 | 14306000000 | 12635892000 |
| Monday, January 1, 2024 | 15801000000 | 12801816000 |
Data in motion
In the competitive landscape of industrial and defense sectors, Parker-Hannifin Corporation and L3Harris Technologies, Inc. have been pivotal players. Over the past decade, Parker-Hannifin consistently maintained a higher cost of revenue, averaging around 10% more than L3Harris. This reflects its expansive operations in motion and control technologies. Notably, in 2023, Parker-Hannifin's cost of revenue peaked at approximately $12.6 billion, marking a 24% increase from 2014. Meanwhile, L3Harris, a leader in defense technology, saw a significant rise in its cost of revenue, reaching $14.3 billion in 2023, a staggering 503% increase from 2014. This surge underscores its strategic expansions and acquisitions. However, data for 2024 is incomplete, leaving room for speculation on future trends. As these giants continue to evolve, their financial strategies will be crucial in shaping their market dominance.

Comparing Revenue Performance: Parker-Hannifin Corporation or L3Harris Technologies, Inc.?
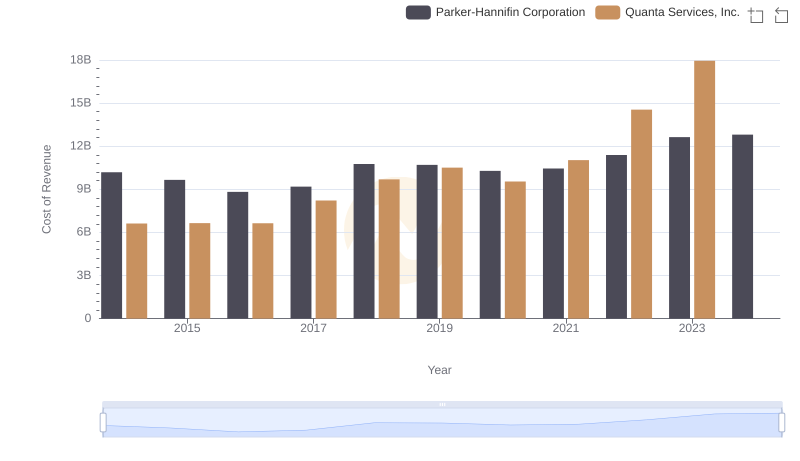
Parker-Hannifin Corporation vs Quanta Services, Inc.: Efficiency in Cost of Revenue Explored
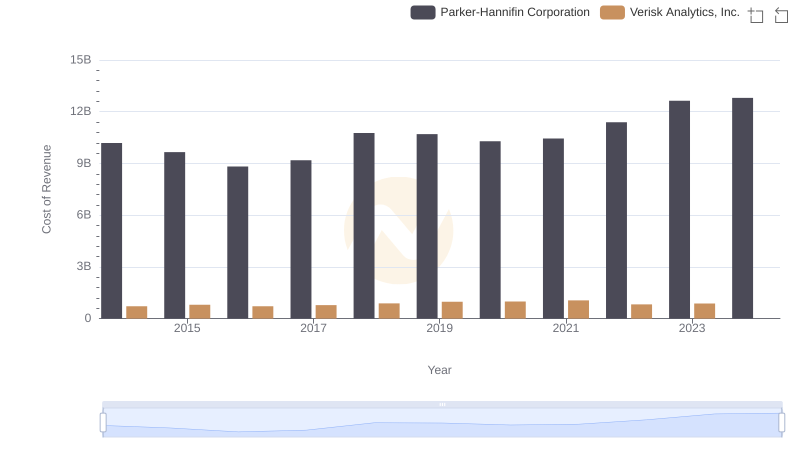
Cost of Revenue Comparison: Parker-Hannifin Corporation vs Verisk Analytics, Inc.
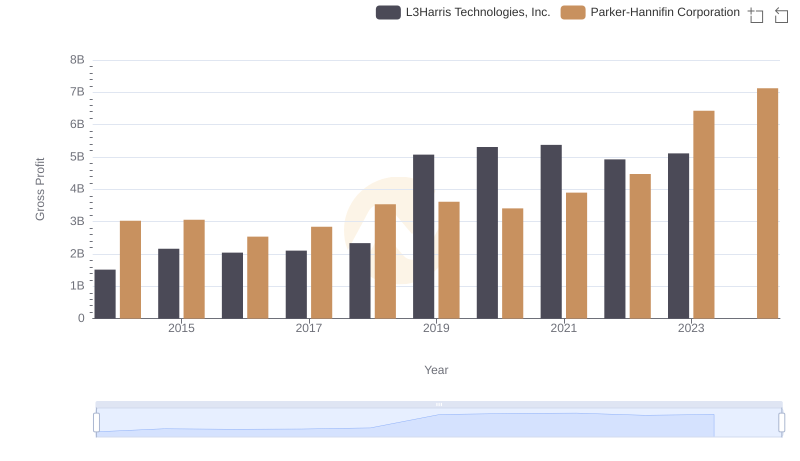
Parker-Hannifin Corporation vs L3Harris Technologies, Inc.: A Gross Profit Performance Breakdown

Cost of Revenue Comparison: Parker-Hannifin Corporation vs Ferguson plc
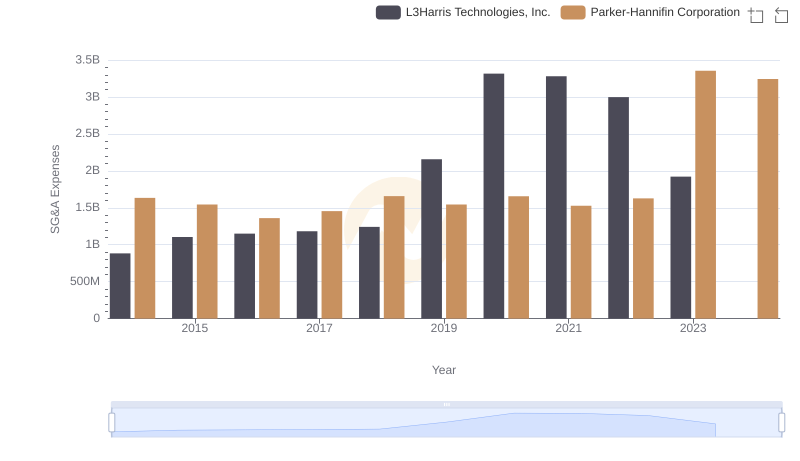
Who Optimizes SG&A Costs Better? Parker-Hannifin Corporation or L3Harris Technologies, Inc.