| __timestamp | L3Harris Technologies, Inc. | Parker-Hannifin Corporation |
|---|---|---|
| Wednesday, January 1, 2014 | 1515000000 | 3027744000 |
| Thursday, January 1, 2015 | 2160000000 | 3056499000 |
| Friday, January 1, 2016 | 2043000000 | 2537369000 |
| Sunday, January 1, 2017 | 2102000000 | 2840350000 |
| Monday, January 1, 2018 | 2334000000 | 3539551000 |
| Tuesday, January 1, 2019 | 5074000000 | 3616840000 |
| Wednesday, January 1, 2020 | 5308000000 | 3409002000 |
| Friday, January 1, 2021 | 5376000000 | 3897960000 |
| Saturday, January 1, 2022 | 4927000000 | 4474341000 |
| Sunday, January 1, 2023 | 5113000000 | 6429302000 |
| Monday, January 1, 2024 | 5524000000 | 7127790000 |
Unleashing insights
In the competitive landscape of industrial and defense sectors, Parker-Hannifin Corporation and L3Harris Technologies, Inc. have showcased intriguing trends in gross profit over the past decade. From 2014 to 2023, Parker-Hannifin's gross profit surged by approximately 112%, peaking in 2023 with a remarkable 6.43 billion. In contrast, L3Harris Technologies experienced a more modest growth of around 237% from 2014 to 2023, reaching its zenith in 2021 with 5.38 billion.
The data reveals a fascinating shift in 2019 when L3Harris briefly overtook Parker-Hannifin, only to be surpassed again by 2023. This dynamic interplay highlights the resilience and strategic maneuvers of these industry titans. As we look to the future, the absence of 2024 data for L3Harris leaves room for speculation on how these giants will continue to evolve.

Comparing Revenue Performance: Parker-Hannifin Corporation or L3Harris Technologies, Inc.?
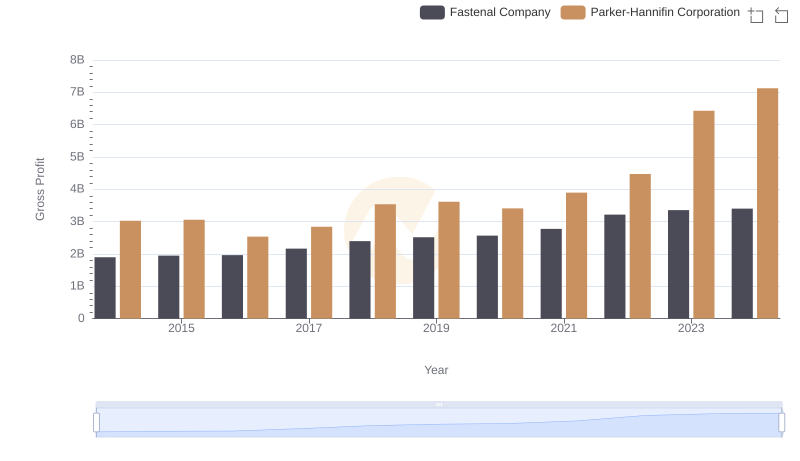
Key Insights on Gross Profit: Parker-Hannifin Corporation vs Fastenal Company
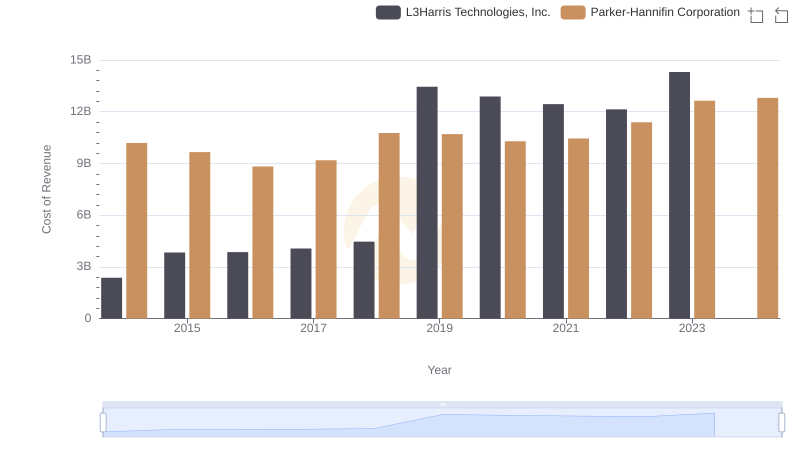
Cost of Revenue Comparison: Parker-Hannifin Corporation vs L3Harris Technologies, Inc.
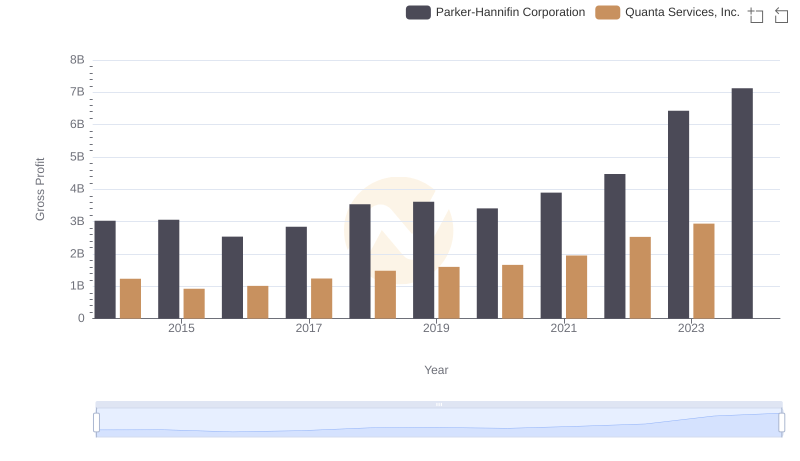
Key Insights on Gross Profit: Parker-Hannifin Corporation vs Quanta Services, Inc.
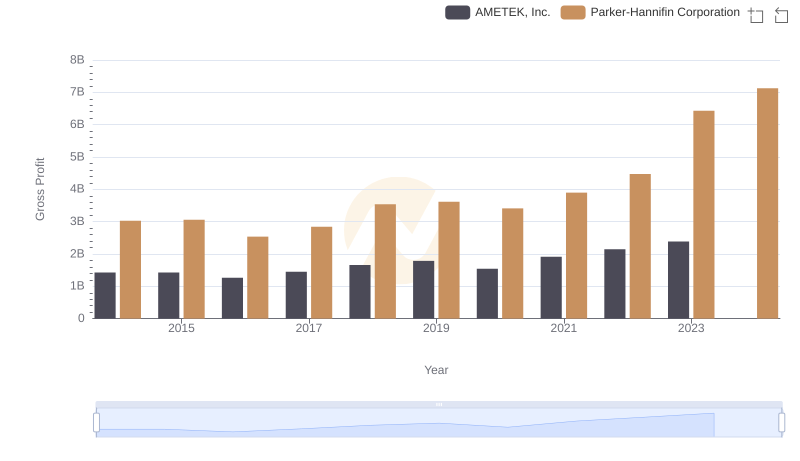
Key Insights on Gross Profit: Parker-Hannifin Corporation vs AMETEK, Inc.
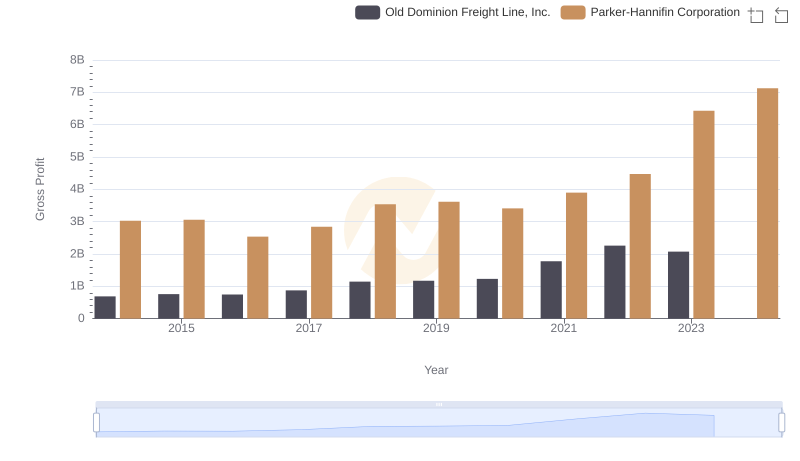
Parker-Hannifin Corporation vs Old Dominion Freight Line, Inc.: A Gross Profit Performance Breakdown
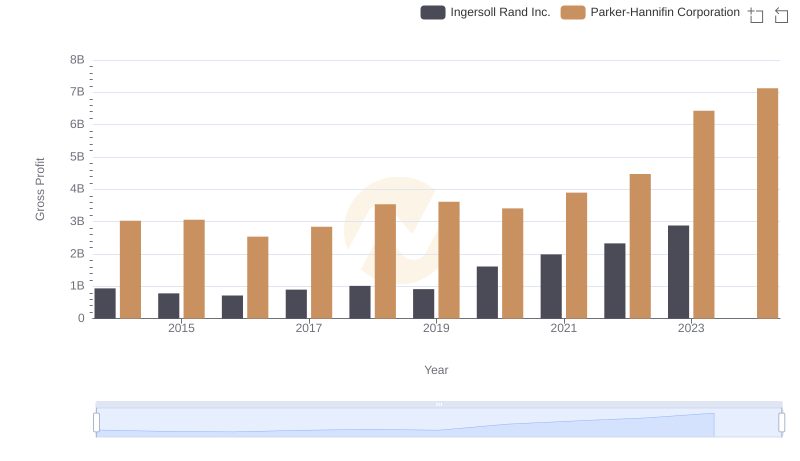
Gross Profit Analysis: Comparing Parker-Hannifin Corporation and Ingersoll Rand Inc.
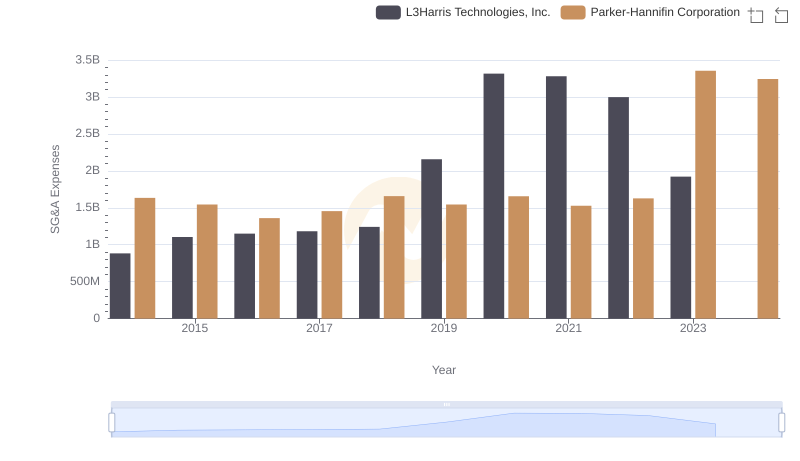
Who Optimizes SG&A Costs Better? Parker-Hannifin Corporation or L3Harris Technologies, Inc.

Who Generates Higher Gross Profit? Parker-Hannifin Corporation or Westinghouse Air Brake Technologies Corporation
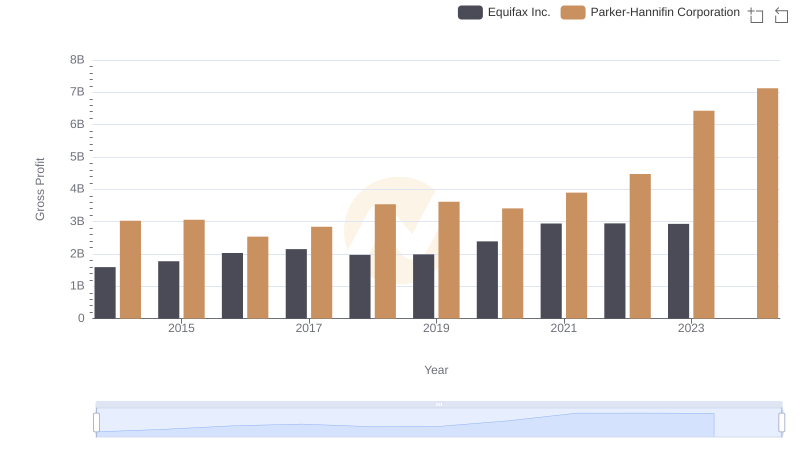
Parker-Hannifin Corporation and Equifax Inc.: A Detailed Gross Profit Analysis