| __timestamp | CSX Corporation | Clean Harbors, Inc. |
|---|---|---|
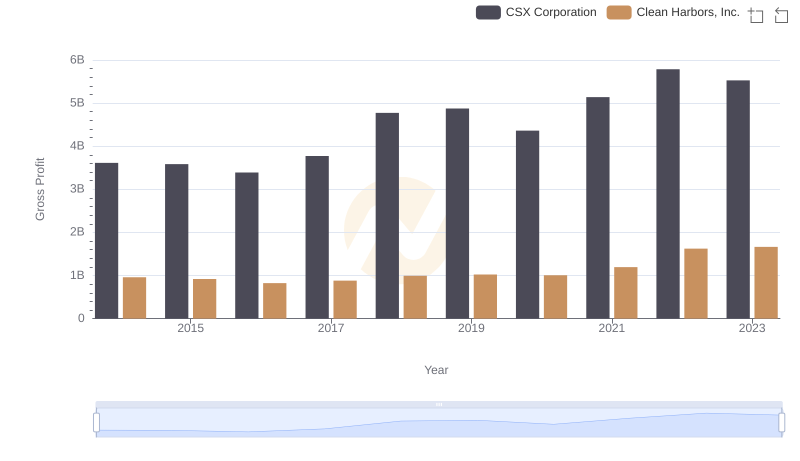
| Wednesday, January 1, 2014 | 12669000000 | 3401636000 |
| Thursday, January 1, 2015 | 11811000000 | 3275137000 |
| Friday, January 1, 2016 | 11069000000 | 2755226000 |
| Sunday, January 1, 2017 | 11408000000 | 2944978000 |
| Monday, January 1, 2018 | 12250000000 | 3300303000 |
| Tuesday, January 1, 2019 | 11937000000 | 3412190000 |
| Wednesday, January 1, 2020 | 10583000000 | 3144097000 |
| Friday, January 1, 2021 | 12522000000 | 3805566000 |
| Saturday, January 1, 2022 | 14853000000 | 5166605000 |
| Sunday, January 1, 2023 | 14657000000 | 5409152000 |
| Monday, January 1, 2024 | 5889952000 |
Igniting the spark of knowledge
In the competitive landscape of the transportation and environmental services sectors, CSX Corporation and Clean Harbors, Inc. have demonstrated remarkable revenue trajectories over the past decade. From 2014 to 2023, CSX Corporation, a leader in rail-based freight transportation, saw its revenue grow by approximately 16%, peaking in 2022 with a 25% increase from its 2020 low. Meanwhile, Clean Harbors, Inc., a prominent player in environmental and industrial services, experienced a robust 97% revenue surge, culminating in 2023. This growth underscores the resilience and adaptability of these companies amidst economic fluctuations. Notably, Clean Harbors' revenue nearly doubled, reflecting its strategic expansion and increased demand for environmental services. As we delve into these insights, it becomes evident that both companies have capitalized on their respective market opportunities, setting a benchmark for industry performance.