| __timestamp | Adobe Inc. | Nutanix, Inc. |
|---|---|---|
| Wednesday, January 1, 2014 | 844353000 | 38037000 |
| Thursday, January 1, 2015 | 862730000 | 73510000 |
| Friday, January 1, 2016 | 975987000 | 116400000 |
| Sunday, January 1, 2017 | 1224059000 | 288619000 |
| Monday, January 1, 2018 | 1537812000 | 313777000 |
| Tuesday, January 1, 2019 | 1930228000 | 500719000 |
| Wednesday, January 1, 2020 | 2188000000 | 553978000 |
| Friday, January 1, 2021 | 2540000000 | 556950000 |
| Saturday, January 1, 2022 | 2987000000 | 571962000 |
| Sunday, January 1, 2023 | 3473000000 | 580961000 |
| Monday, January 1, 2024 | 3944000000 | 638992000 |
In pursuit of knowledge
In the ever-evolving tech landscape, research and development (R&D) are pivotal for innovation and growth. Over the past decade, Adobe Inc. and Nutanix, Inc. have demonstrated contrasting trajectories in their R&D investments. Adobe's R&D expenses have surged by over 360% from 2014 to 2024, reflecting its commitment to maintaining a competitive edge in digital media and marketing solutions. In contrast, Nutanix, Inc., a leader in cloud computing, has increased its R&D spending by approximately 1,580% during the same period, underscoring its aggressive push to innovate in a rapidly growing sector. By 2024, Adobe's R&D budget is nearly six times that of Nutanix, highlighting the scale at which these tech giants operate. This analysis provides a window into how strategic R&D investments can shape the future of technology companies.
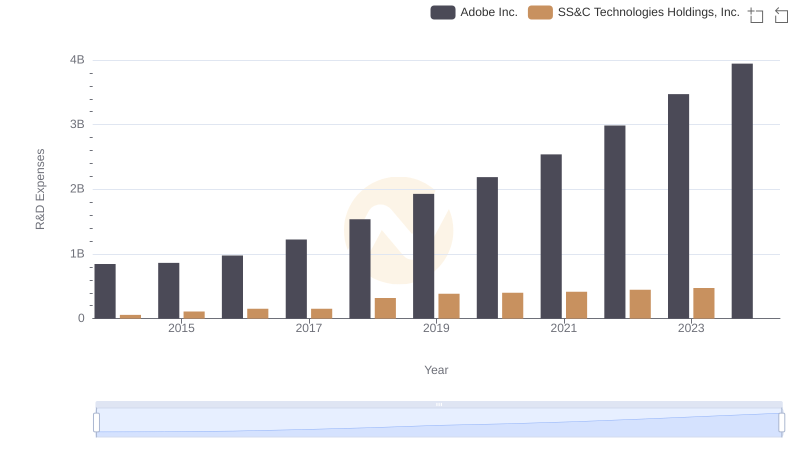
Adobe Inc. or SS&C Technologies Holdings, Inc.: Who Invests More in Innovation?
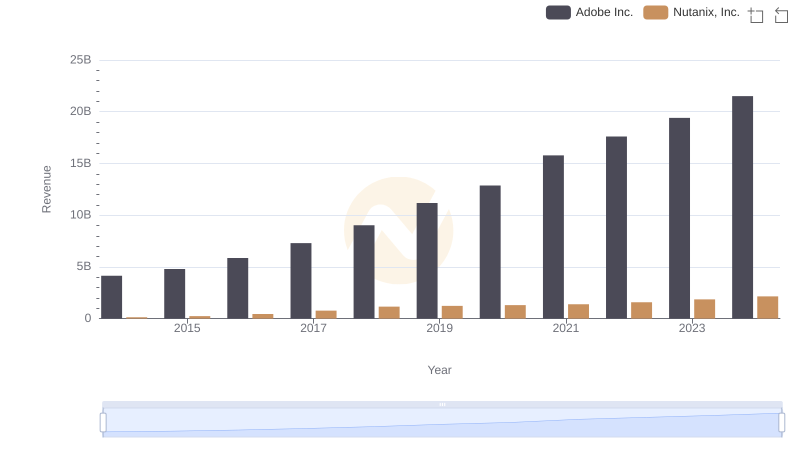
Adobe Inc. vs Nutanix, Inc.: Examining Key Revenue Metrics
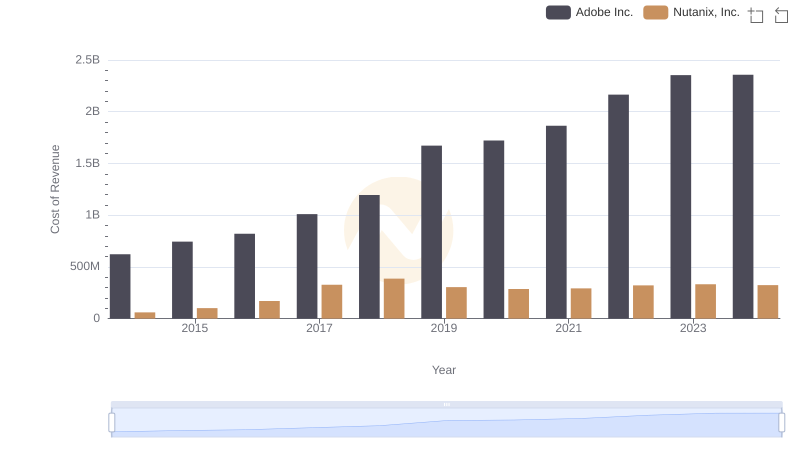
Cost of Revenue Comparison: Adobe Inc. vs Nutanix, Inc.
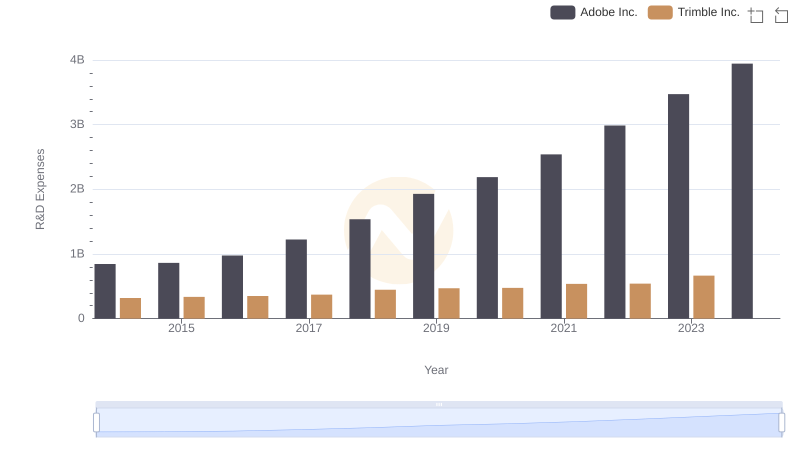
R&D Spending Showdown: Adobe Inc. vs Trimble Inc.
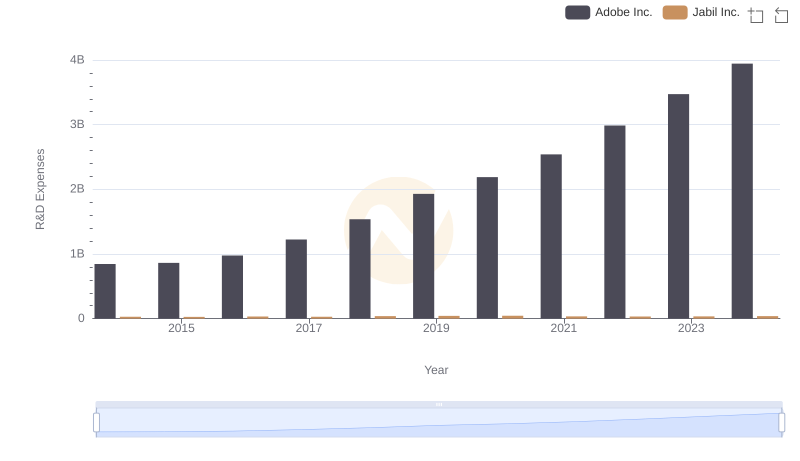
Comparing Innovation Spending: Adobe Inc. and Jabil Inc.
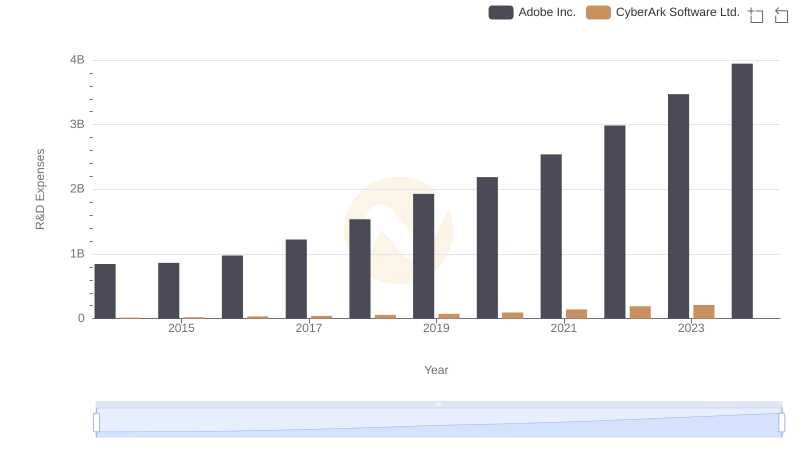
Comparing Innovation Spending: Adobe Inc. and CyberArk Software Ltd.
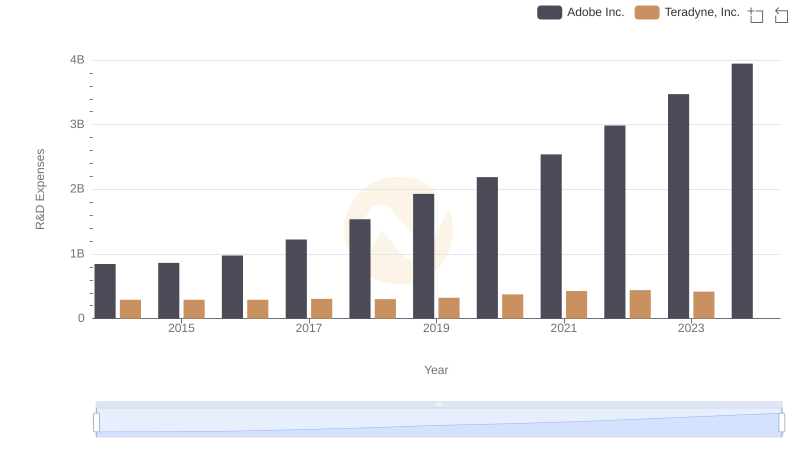
Who Prioritizes Innovation? R&D Spending Compared for Adobe Inc. and Teradyne, Inc.
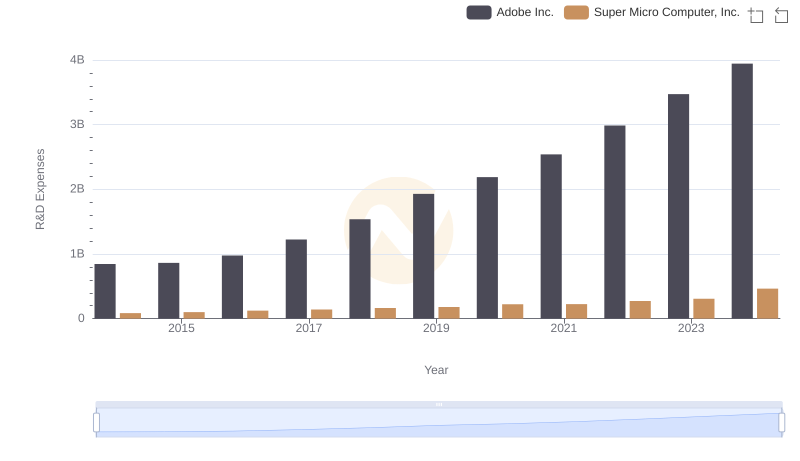
Research and Development Expenses Breakdown: Adobe Inc. vs Super Micro Computer, Inc.
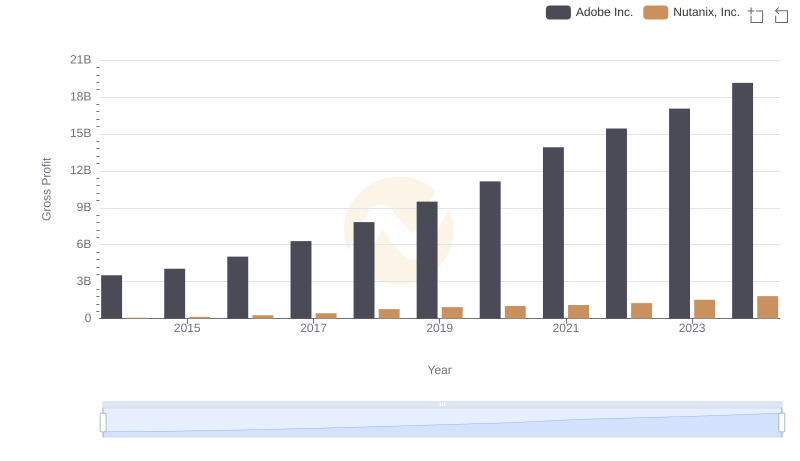
Adobe Inc. and Nutanix, Inc.: A Detailed Gross Profit Analysis
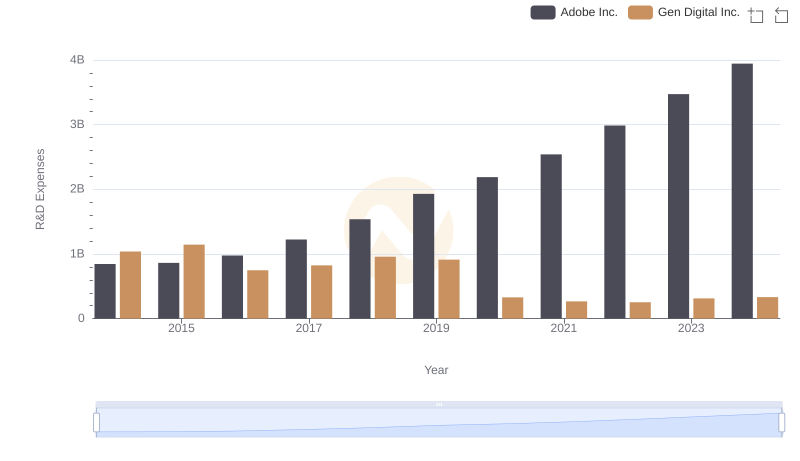
Research and Development: Comparing Key Metrics for Adobe Inc. and Gen Digital Inc.
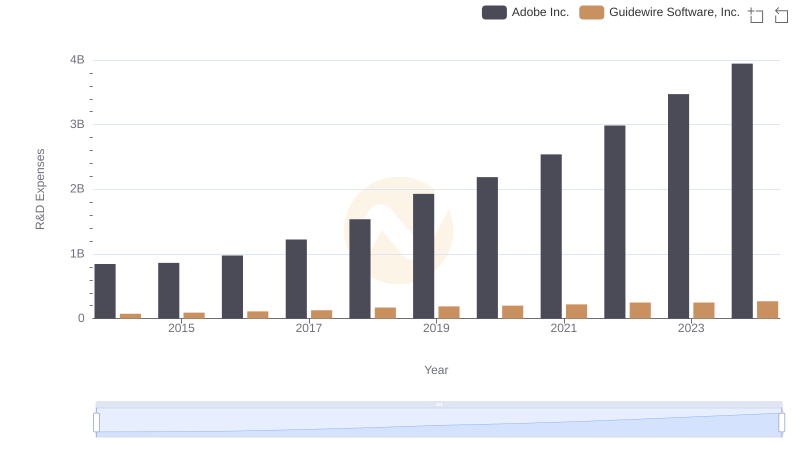
Research and Development: Comparing Key Metrics for Adobe Inc. and Guidewire Software, Inc.
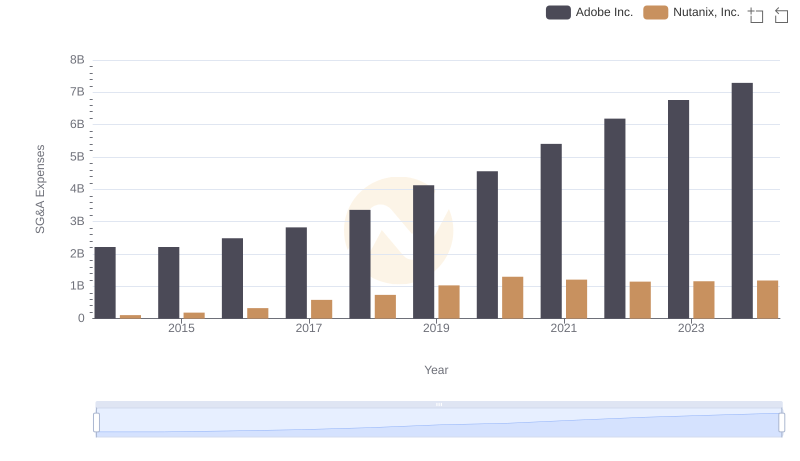
Cost Management Insights: SG&A Expenses for Adobe Inc. and Nutanix, Inc.