| __timestamp | Adobe Inc. | Nutanix, Inc. |
|---|---|---|
| Wednesday, January 1, 2014 | 4147065000 | 127127000 |
| Thursday, January 1, 2015 | 4795511000 | 241432000 |
| Friday, January 1, 2016 | 5854430000 | 444928000 |
| Sunday, January 1, 2017 | 7301505000 | 766869000 |
| Monday, January 1, 2018 | 9030008000 | 1155457000 |
| Tuesday, January 1, 2019 | 11171297000 | 1236143000 |
| Wednesday, January 1, 2020 | 12868000000 | 1307682000 |
| Friday, January 1, 2021 | 15785000000 | 1394364000 |
| Saturday, January 1, 2022 | 17606000000 | 1580796000 |
| Sunday, January 1, 2023 | 19409000000 | 1862895000 |
| Monday, January 1, 2024 | 21505000000 | 2148816000 |
Unleashing the power of data
In the ever-evolving tech landscape, Adobe Inc. and Nutanix, Inc. have charted distinct paths over the past decade. Adobe, a stalwart in digital media solutions, has seen its revenue skyrocket by over 400% from 2014 to 2024, reflecting its strategic shift towards cloud-based services. In contrast, Nutanix, a leader in enterprise cloud solutions, has experienced a remarkable 1,590% revenue growth in the same period, underscoring its rapid ascent in the tech industry.
Adobe's revenue growth, averaging 15% annually, highlights its robust market position and innovative product offerings. Meanwhile, Nutanix's aggressive expansion, with an average annual growth rate of 40%, showcases its disruptive potential in the cloud computing sector. As we look to the future, these trends suggest a dynamic interplay between established giants and emerging innovators, shaping the digital economy's trajectory.
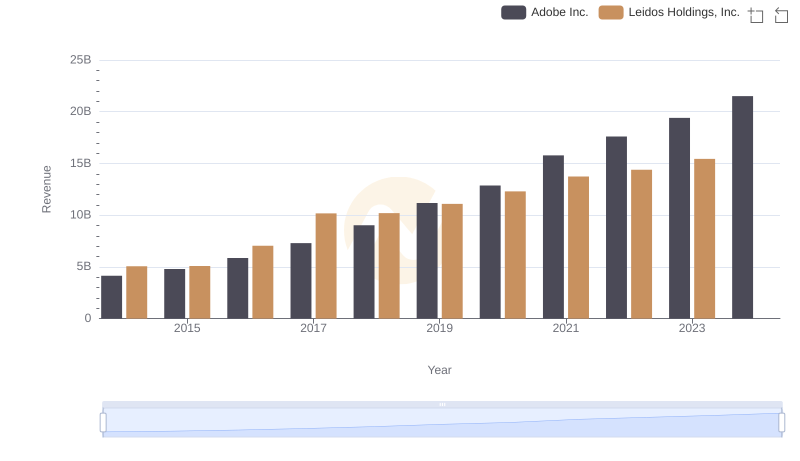
Adobe Inc. and Leidos Holdings, Inc.: A Comprehensive Revenue Analysis

Revenue Insights: Adobe Inc. and Teradyne, Inc. Performance Compared
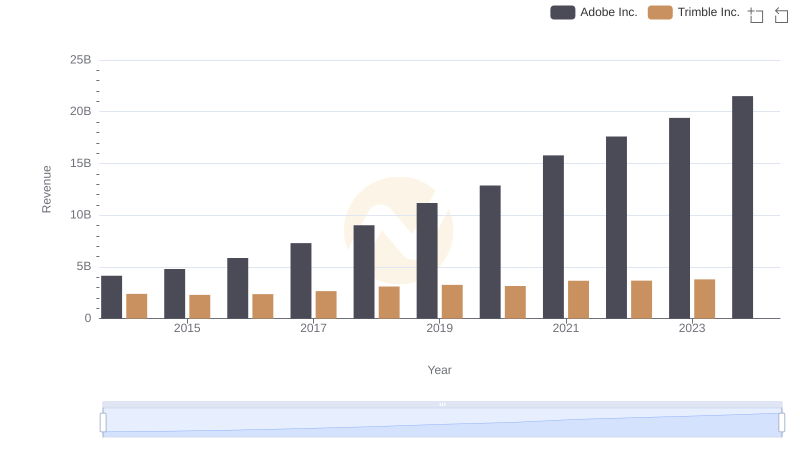
Breaking Down Revenue Trends: Adobe Inc. vs Trimble Inc.
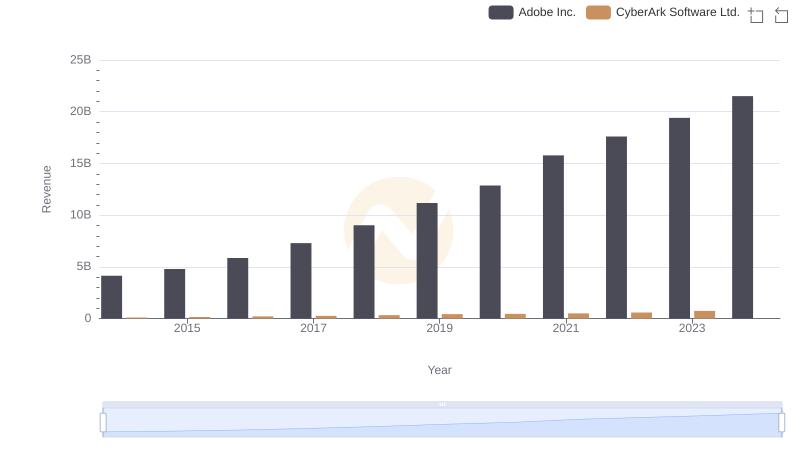
Revenue Showdown: Adobe Inc. vs CyberArk Software Ltd.
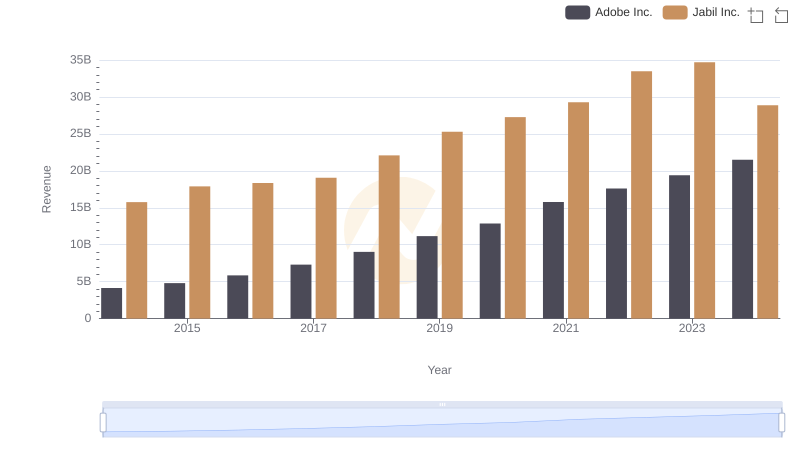
Adobe Inc. and Jabil Inc.: A Comprehensive Revenue Analysis
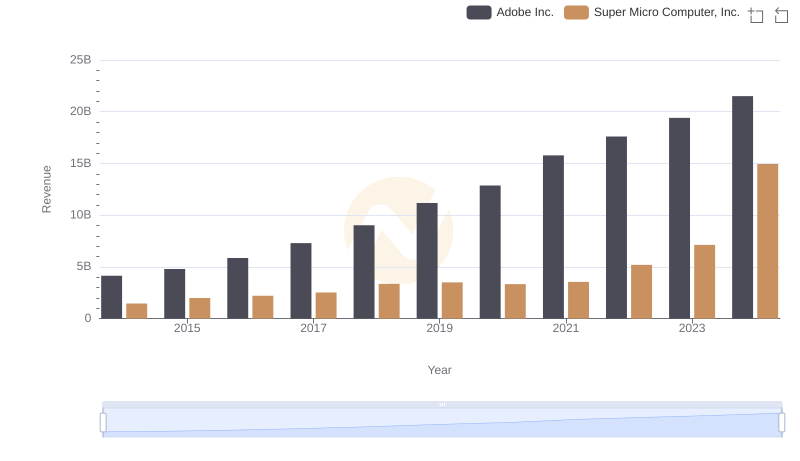
Comparing Revenue Performance: Adobe Inc. or Super Micro Computer, Inc.?
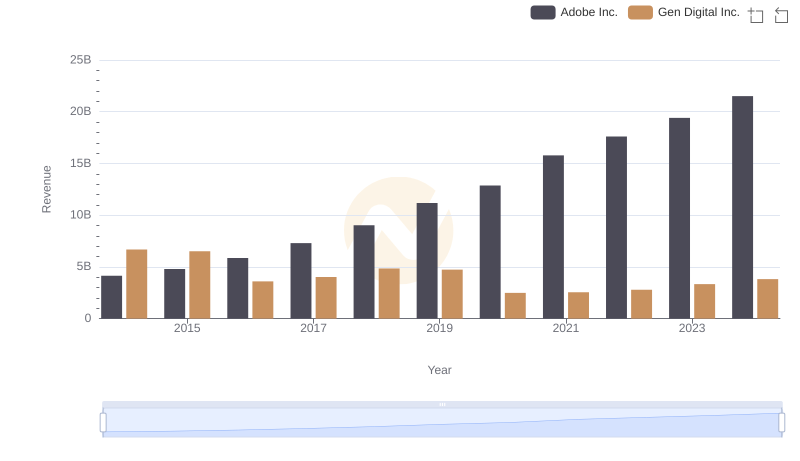
Who Generates More Revenue? Adobe Inc. or Gen Digital Inc.
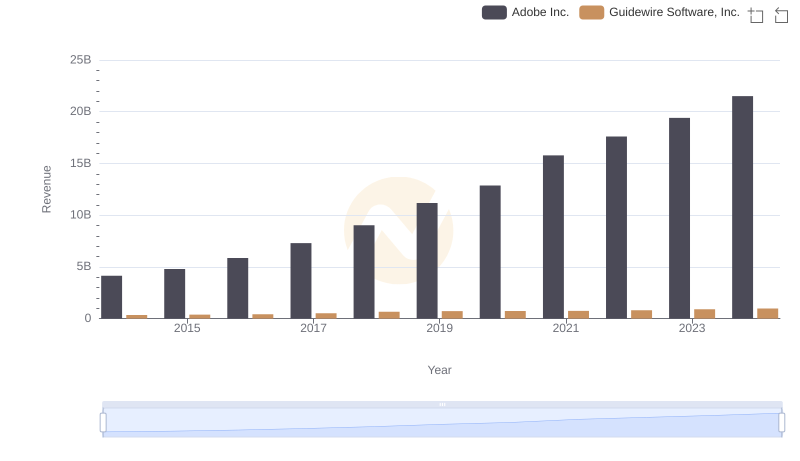
Comparing Revenue Performance: Adobe Inc. or Guidewire Software, Inc.?
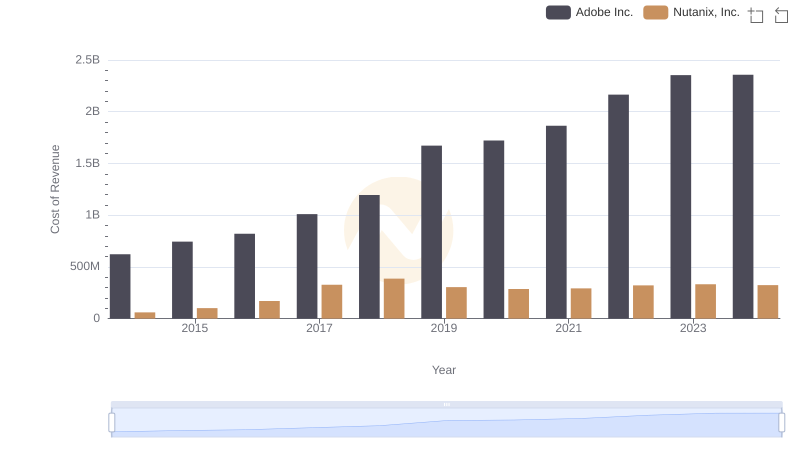
Cost of Revenue Comparison: Adobe Inc. vs Nutanix, Inc.
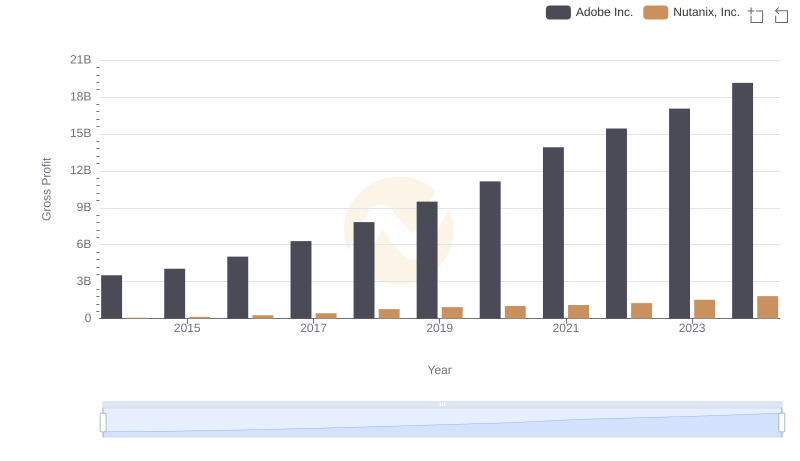
Adobe Inc. and Nutanix, Inc.: A Detailed Gross Profit Analysis
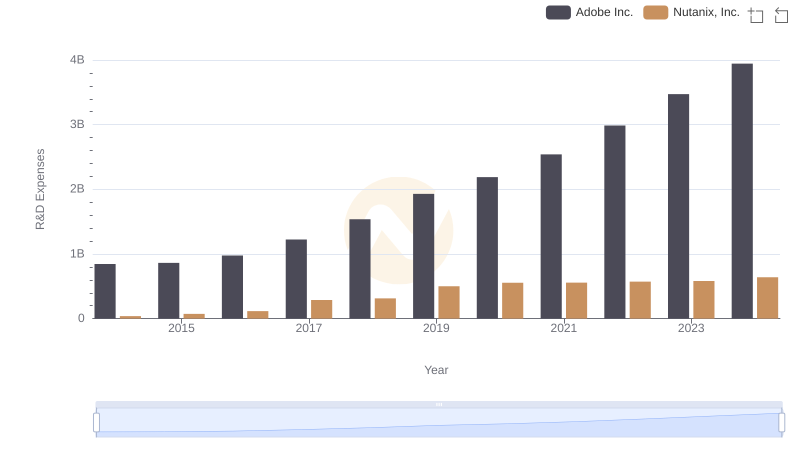
Analyzing R&D Budgets: Adobe Inc. vs Nutanix, Inc.
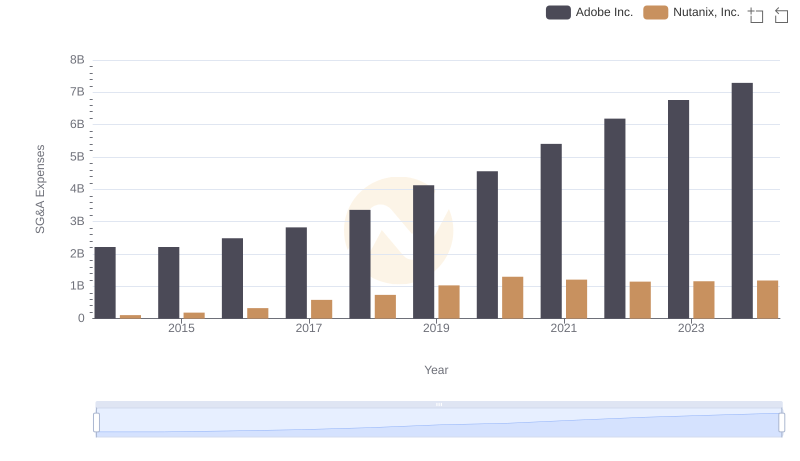
Cost Management Insights: SG&A Expenses for Adobe Inc. and Nutanix, Inc.