| __timestamp | 3M Company | Northrop Grumman Corporation |
|---|---|---|
| Wednesday, January 1, 2014 | 16447000000 | 18378000000 |
| Thursday, January 1, 2015 | 15383000000 | 17884000000 |
| Friday, January 1, 2016 | 15040000000 | 18731000000 |
| Sunday, January 1, 2017 | 16001000000 | 19849000000 |
| Monday, January 1, 2018 | 16682000000 | 23304000000 |
| Tuesday, January 1, 2019 | 17136000000 | 26582000000 |
| Wednesday, January 1, 2020 | 16605000000 | 29321000000 |
| Friday, January 1, 2021 | 18795000000 | 28399000000 |
| Saturday, January 1, 2022 | 19232000000 | 29128000000 |
| Sunday, January 1, 2023 | 18477000000 | 32739000000 |
| Monday, January 1, 2024 | 14447000000 | 32671000000 |
Unleashing the power of data
In the ever-evolving landscape of American industry, 3M Company and Northrop Grumman Corporation stand as titans in their respective fields. Over the past decade, these companies have navigated the complexities of cost management with varying strategies and outcomes. From 2014 to 2023, Northrop Grumman's cost of revenue surged by approximately 78%, reflecting its aggressive expansion and increased production capabilities. In contrast, 3M's cost of revenue exhibited a more modest growth of around 12%, indicating a steady yet cautious approach to scaling operations.
The year 2023 marked a significant divergence, with Northrop Grumman's costs peaking at over 3.27 times that of 3M's, highlighting its substantial investment in defense and aerospace sectors. However, 2024 data for Northrop Grumman remains elusive, leaving room for speculation on future trends. This comparison underscores the dynamic nature of cost management strategies in the face of global economic shifts.

Comparing Revenue Performance: 3M Company or Northrop Grumman Corporation?
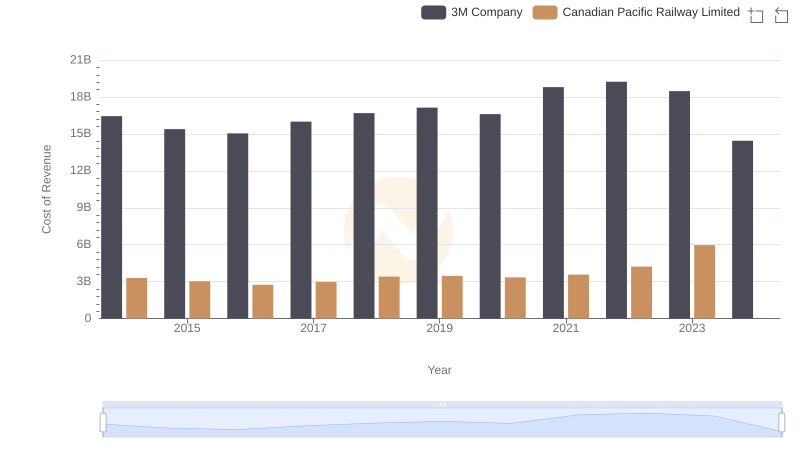
3M Company vs Canadian Pacific Railway Limited: Efficiency in Cost of Revenue Explored

Cost of Revenue: Key Insights for 3M Company and General Dynamics Corporation
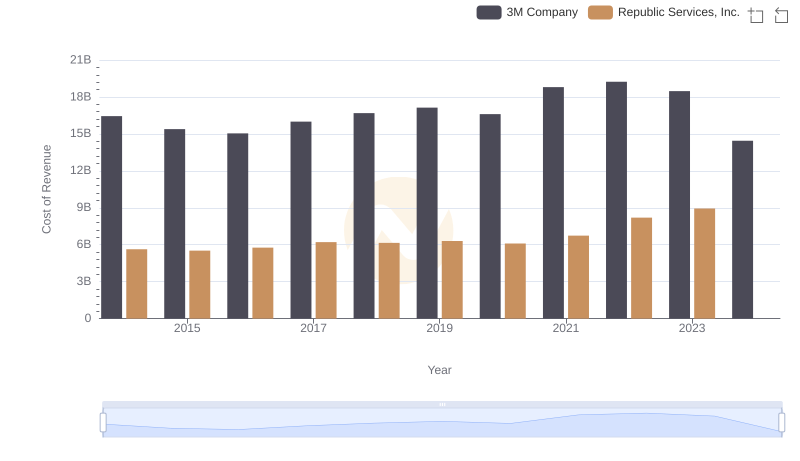
Analyzing Cost of Revenue: 3M Company and Republic Services, Inc.
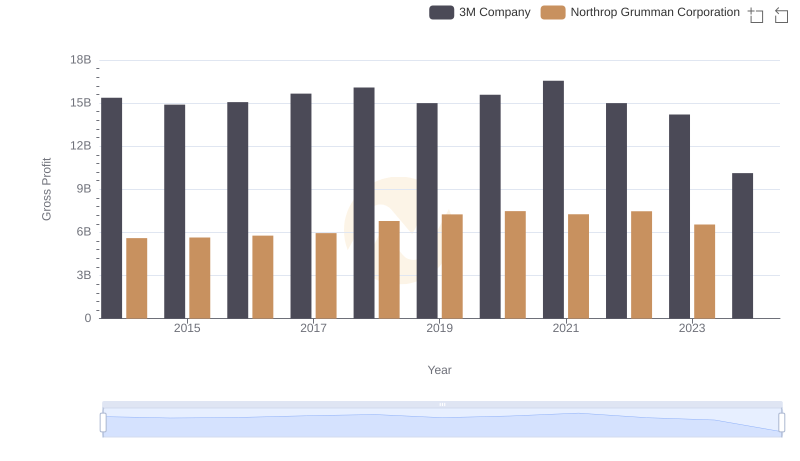
3M Company vs Northrop Grumman Corporation: A Gross Profit Performance Breakdown