| __timestamp | 3M Company | Republic Services, Inc. |
|---|---|---|
| Wednesday, January 1, 2014 | 16447000000 | 5628100000 |
| Thursday, January 1, 2015 | 15383000000 | 5518600000 |
| Friday, January 1, 2016 | 15040000000 | 5764000000 |
| Sunday, January 1, 2017 | 16001000000 | 6214600000 |
| Monday, January 1, 2018 | 16682000000 | 6150000000 |
| Tuesday, January 1, 2019 | 17136000000 | 6298400000 |
| Wednesday, January 1, 2020 | 16605000000 | 6100500000 |
| Friday, January 1, 2021 | 18795000000 | 6737700000 |
| Saturday, January 1, 2022 | 19232000000 | 8204700000 |
| Sunday, January 1, 2023 | 18477000000 | 8942200000 |
| Monday, January 1, 2024 | 14447000000 | 9350000000 |
Data in motion
In the ever-evolving landscape of American industry, 3M Company and Republic Services, Inc. stand as titans in their respective fields. From 2014 to 2023, these companies have showcased intriguing trends in their cost of revenue, a critical metric reflecting the direct costs attributable to the production of goods sold by a company.
3M Company, a stalwart in manufacturing, saw its cost of revenue fluctuate, peaking in 2022 with a 17% increase from 2014. However, 2023 marked a notable decline, dropping by 25% from the previous year, indicating potential strategic shifts or market challenges.
Conversely, Republic Services, Inc., a leader in waste management, demonstrated a steady upward trajectory, with a remarkable 59% increase in cost of revenue from 2014 to 2023. This growth underscores the rising demand for sustainable waste solutions.
While 2024 data for Republic Services remains elusive, these trends offer a fascinating glimpse into the financial dynamics of two industry leaders.
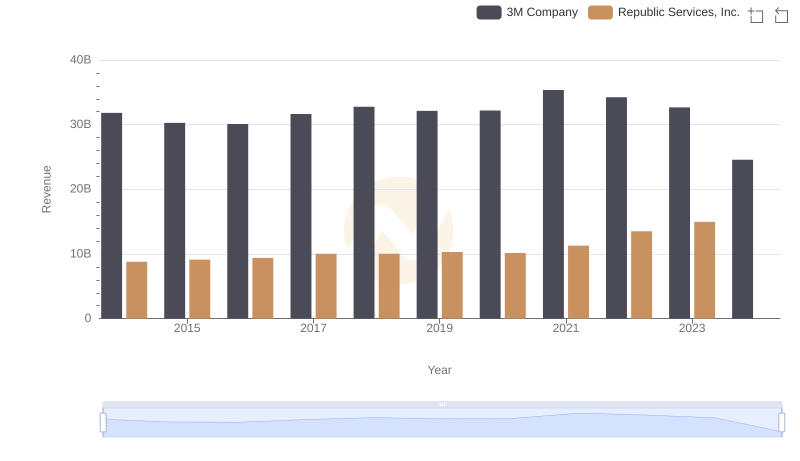
Annual Revenue Comparison: 3M Company vs Republic Services, Inc.

Cost of Revenue: Key Insights for 3M Company and General Dynamics Corporation
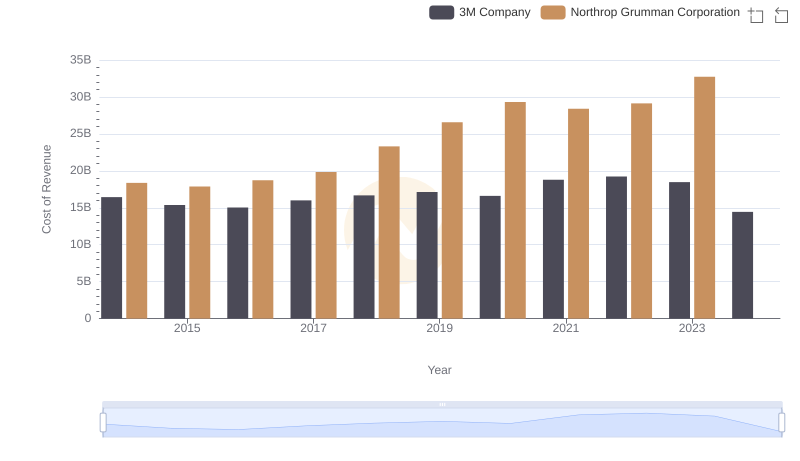
Cost of Revenue Comparison: 3M Company vs Northrop Grumman Corporation
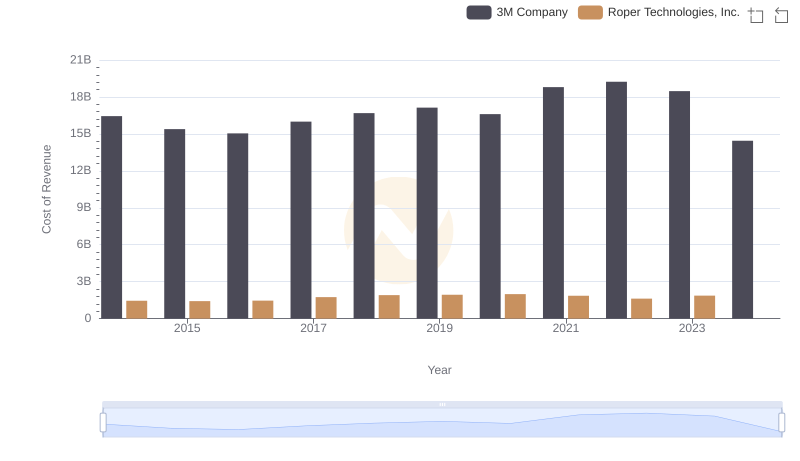
Cost of Revenue: Key Insights for 3M Company and Roper Technologies, Inc.
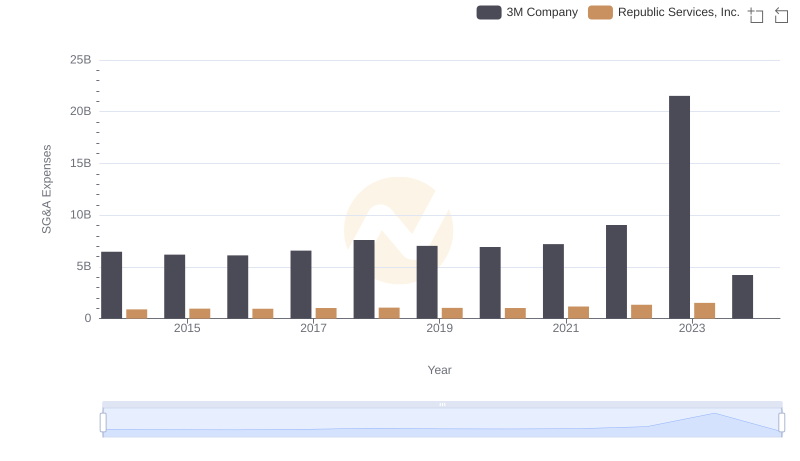
Comparing SG&A Expenses: 3M Company vs Republic Services, Inc. Trends and Insights