| __timestamp | 3M Company | General Dynamics Corporation |
|---|---|---|
| Wednesday, January 1, 2014 | 16447000000 | 24979000000 |
| Thursday, January 1, 2015 | 15383000000 | 25339000000 |
| Friday, January 1, 2016 | 15040000000 | 25104000000 |
| Sunday, January 1, 2017 | 16001000000 | 24786000000 |
| Monday, January 1, 2018 | 16682000000 | 29478000000 |
| Tuesday, January 1, 2019 | 17136000000 | 32291000000 |
| Wednesday, January 1, 2020 | 16605000000 | 31600000000 |
| Friday, January 1, 2021 | 18795000000 | 32061000000 |
| Saturday, January 1, 2022 | 19232000000 | 32785000000 |
| Sunday, January 1, 2023 | 18477000000 | 35600000000 |
| Monday, January 1, 2024 | 14447000000 | 40352000000 |
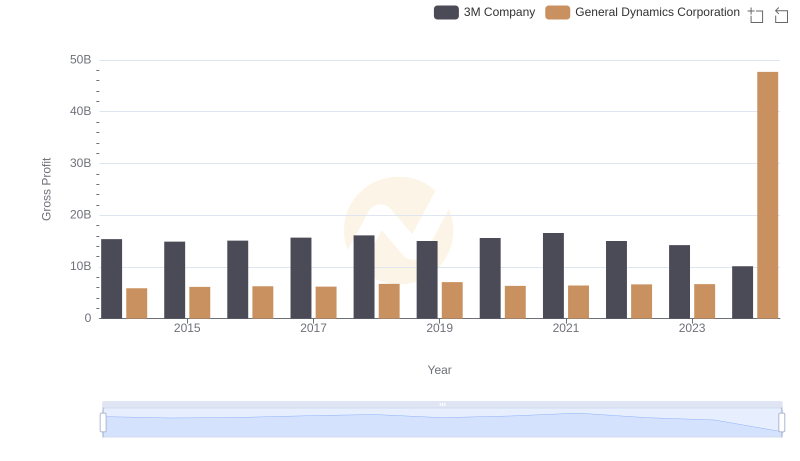
Data in motion
In the ever-evolving landscape of American industry, understanding the cost of revenue is crucial for evaluating a company's financial health. From 2014 to 2023, 3M Company and General Dynamics Corporation have shown distinct trajectories in their cost of revenue. 3M's cost of revenue has fluctuated, peaking in 2022 with a 17% increase from 2014, before dropping by 25% in 2024. In contrast, General Dynamics has seen a steady rise, culminating in a 43% increase by 2023. This divergence highlights the differing operational strategies and market conditions faced by these industrial giants. Notably, the absence of data for General Dynamics in 2024 suggests a potential shift or reporting anomaly. As these companies navigate the complexities of global markets, their cost of revenue remains a key indicator of their strategic priorities and operational efficiencies.