| __timestamp | 3M Company | Northrop Grumman Corporation |
|---|---|---|
| Wednesday, January 1, 2014 | 15374000000 | 5601000000 |
| Thursday, January 1, 2015 | 14891000000 | 5642000000 |
| Friday, January 1, 2016 | 15069000000 | 5777000000 |
| Sunday, January 1, 2017 | 15656000000 | 5954000000 |
| Monday, January 1, 2018 | 16083000000 | 6791000000 |
| Tuesday, January 1, 2019 | 15000000000 | 7259000000 |
| Wednesday, January 1, 2020 | 15579000000 | 7478000000 |
| Friday, January 1, 2021 | 16560000000 | 7268000000 |
| Saturday, January 1, 2022 | 14997000000 | 7474000000 |
| Sunday, January 1, 2023 | 14204000000 | 6551000000 |
| Monday, January 1, 2024 | 10128000000 | 8362000000 |
Unlocking the unknown
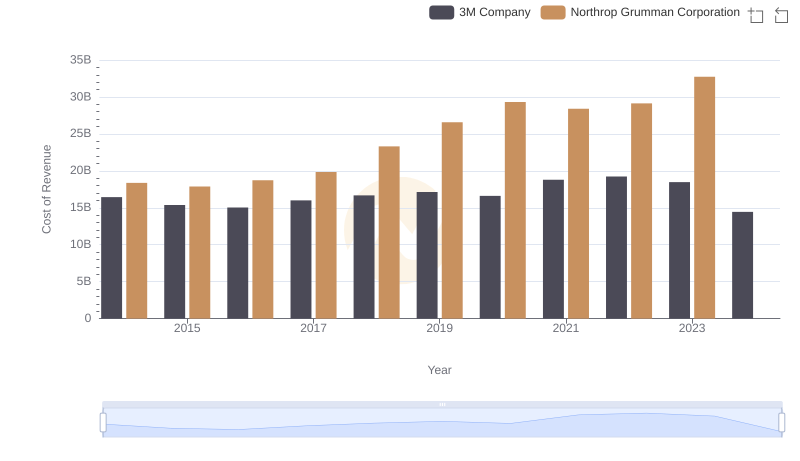
In the ever-evolving landscape of American industry, 3M Company and Northrop Grumman Corporation stand as titans in their respective fields. From 2014 to 2023, these companies have showcased distinct trajectories in gross profit performance.
3M, a stalwart in manufacturing, saw its gross profit peak in 2021, reaching approximately 16.6 billion, before experiencing a decline to around 14.2 billion in 2023. This represents a decrease of about 15% over two years, reflecting challenges in the manufacturing sector.
Conversely, Northrop Grumman, a leader in defense technology, demonstrated a steady climb, with gross profits increasing by roughly 33% from 2014 to 2022. However, data for 2024 remains elusive, leaving room for speculation on future trends.
This comparative analysis highlights the dynamic nature of industry-specific challenges and opportunities, offering a glimpse into the strategic maneuvers of these corporate giants.