| __timestamp | 3M Company | Northrop Grumman Corporation |
|---|---|---|
| Wednesday, January 1, 2014 | 31821000000 | 23979000000 |
| Thursday, January 1, 2015 | 30274000000 | 23526000000 |
| Friday, January 1, 2016 | 30109000000 | 24508000000 |
| Sunday, January 1, 2017 | 31657000000 | 25803000000 |
| Monday, January 1, 2018 | 32765000000 | 30095000000 |
| Tuesday, January 1, 2019 | 32136000000 | 33841000000 |
| Wednesday, January 1, 2020 | 32184000000 | 36799000000 |
| Friday, January 1, 2021 | 35355000000 | 35667000000 |
| Saturday, January 1, 2022 | 34229000000 | 36602000000 |
| Sunday, January 1, 2023 | 32681000000 | 39290000000 |
| Monday, January 1, 2024 | 24575000000 | 41033000000 |
Unveiling the hidden dimensions of data
In the ever-evolving landscape of American industry, the revenue trajectories of 3M Company and Northrop Grumman Corporation offer a fascinating glimpse into the economic forces shaping these giants. From 2014 to 2023, 3M's revenue showcased a steady yet modest growth, peaking in 2021 with a 10% increase from its 2014 figures. However, 2024 data reveals a significant drop, indicating potential challenges ahead.
Conversely, Northrop Grumman's revenue journey tells a story of robust growth, with a remarkable 64% increase from 2014 to 2023. This surge underscores the company's strategic positioning in the defense sector, especially during times of heightened geopolitical tensions.
While 3M's revenue faced a downturn in 2024, Northrop Grumman's data for the same year remains elusive, leaving room for speculation. This comparison not only highlights the diverse paths of these corporations but also reflects broader economic trends.
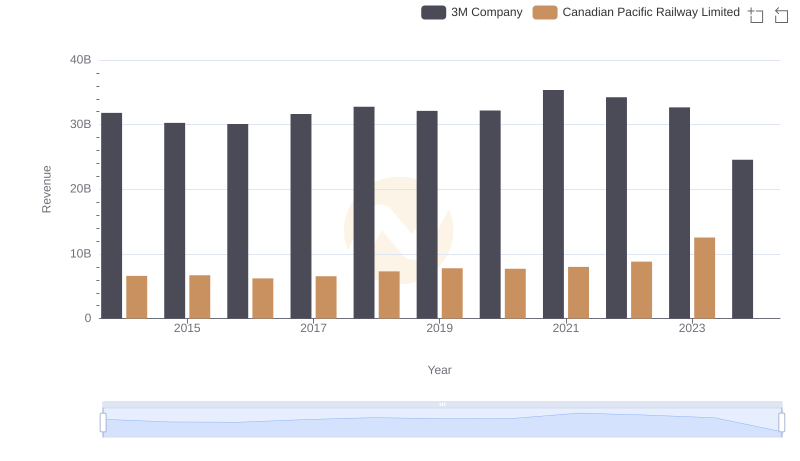
3M Company and Canadian Pacific Railway Limited: A Comprehensive Revenue Analysis
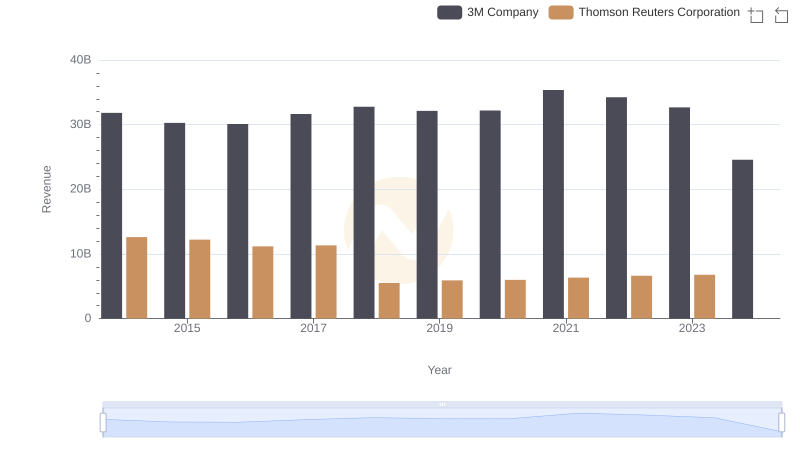
Revenue Insights: 3M Company and Thomson Reuters Corporation Performance Compared
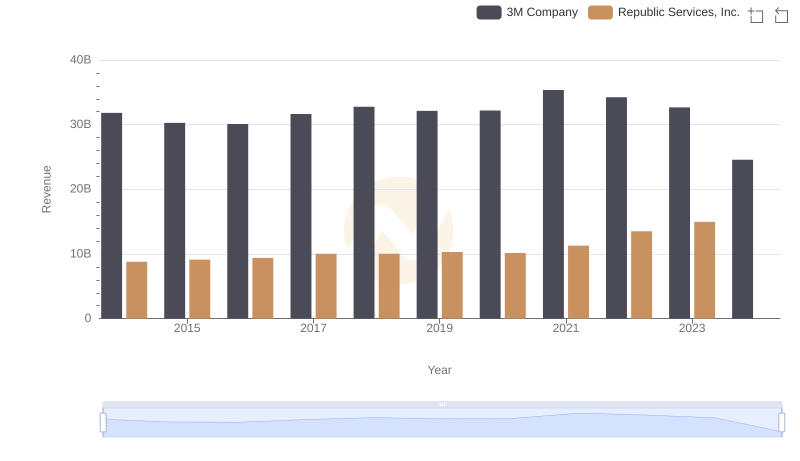
Annual Revenue Comparison: 3M Company vs Republic Services, Inc.

Revenue Showdown: 3M Company vs Canadian National Railway Company
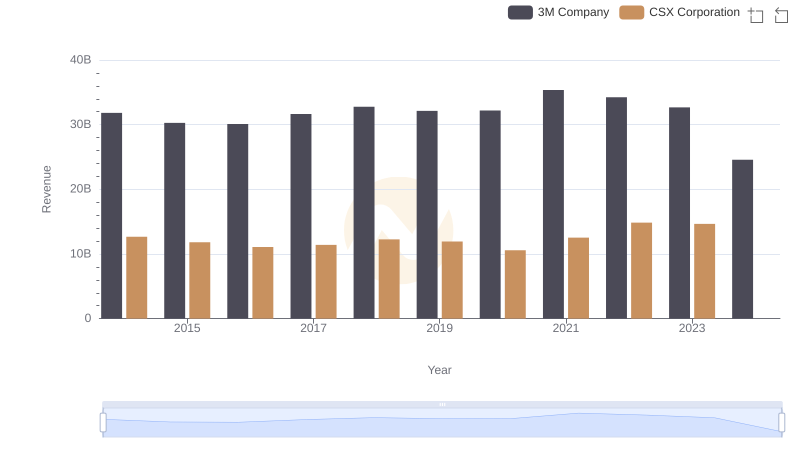
3M Company vs CSX Corporation: Annual Revenue Growth Compared
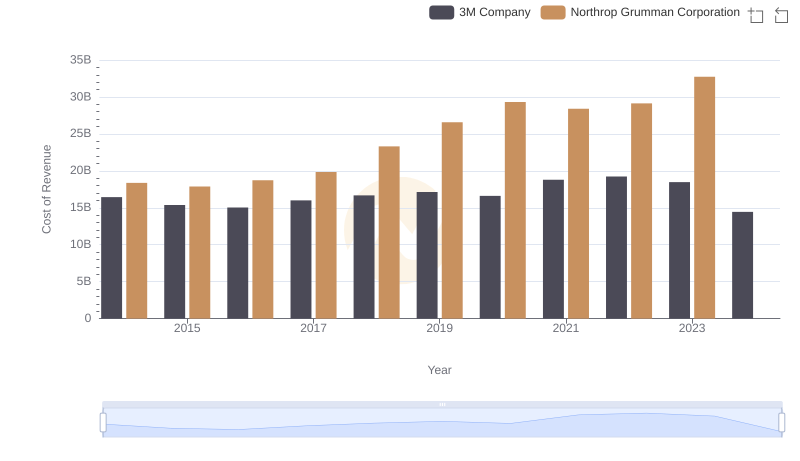
Cost of Revenue Comparison: 3M Company vs Northrop Grumman Corporation
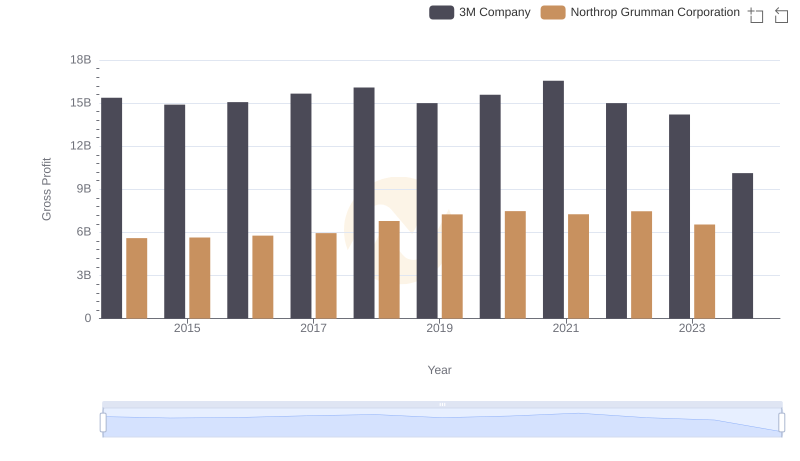
3M Company vs Northrop Grumman Corporation: A Gross Profit Performance Breakdown