| __timestamp | Dell Technologies Inc. | Seagate Technology Holdings plc |
|---|---|---|
| Wednesday, January 1, 2014 | 8906000000 | 722000000 |
| Thursday, January 1, 2015 | 8292000000 | 857000000 |
| Friday, January 1, 2016 | 7850000000 | 635000000 |
| Sunday, January 1, 2017 | 13403000000 | 606000000 |
| Monday, January 1, 2018 | 18569000000 | 562000000 |
| Tuesday, January 1, 2019 | 20640000000 | 453000000 |
| Wednesday, January 1, 2020 | 15819000000 | 473000000 |
| Friday, January 1, 2021 | 14000000000 | 502000000 |
| Saturday, January 1, 2022 | 14655000000 | 559000000 |
| Sunday, January 1, 2023 | 14136000000 | 491000000 |
| Monday, January 1, 2024 | 12857000000 | 460000000 |
Unveiling the hidden dimensions of data
In the ever-evolving landscape of technology, effective cost management is crucial for sustaining growth and competitiveness. Over the past decade, Dell Technologies Inc. and Seagate Technology Holdings plc have demonstrated contrasting trends in their Selling, General, and Administrative (SG&A) expenses. From 2014 to 2024, Dell's SG&A expenses surged by approximately 44%, peaking in 2019, while Seagate's expenses exhibited a more stable pattern, with a slight decline of around 36% over the same period. This divergence highlights Dell's aggressive expansion strategies compared to Seagate's more conservative approach. Notably, Dell's expenses reached their zenith in 2019, coinciding with strategic acquisitions and market expansion efforts. Meanwhile, Seagate's consistent cost management reflects its focus on operational efficiency. As we look to the future, these insights offer valuable lessons in balancing growth with fiscal prudence in the tech industry.
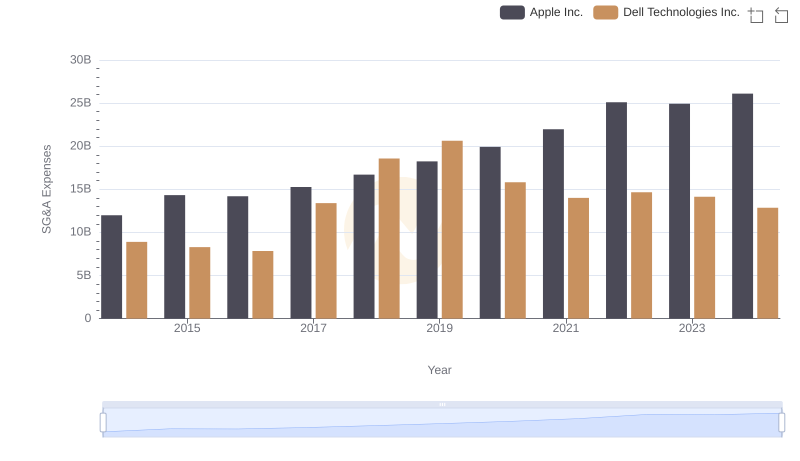
Breaking Down SG&A Expenses: Apple Inc. vs Dell Technologies Inc.
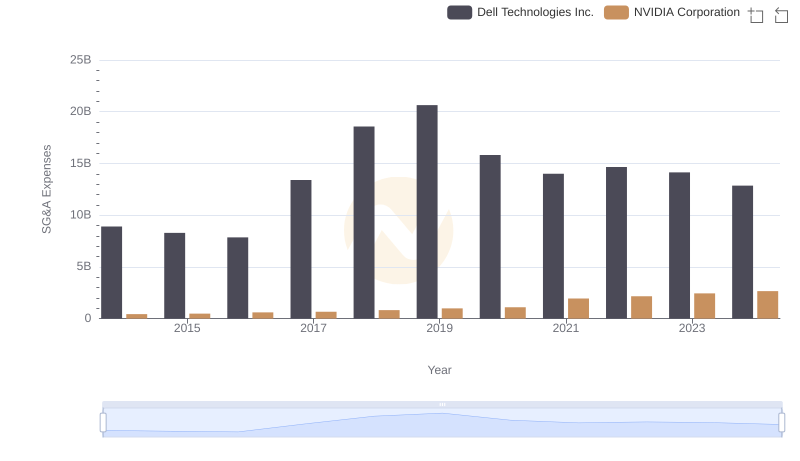
Selling, General, and Administrative Costs: NVIDIA Corporation vs Dell Technologies Inc.
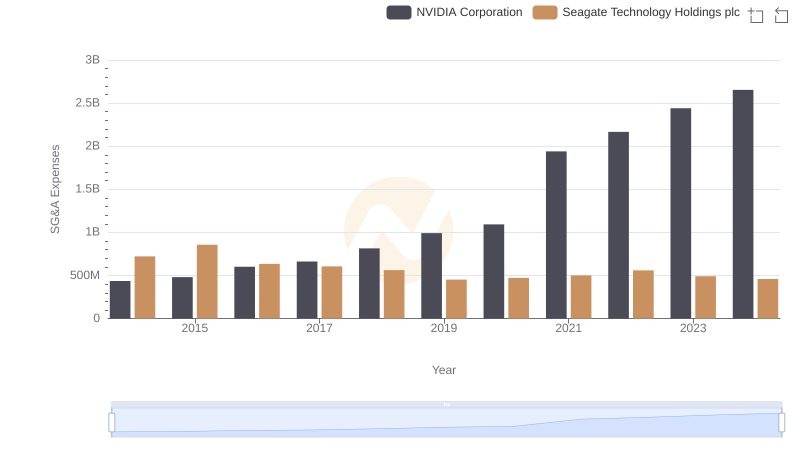
SG&A Efficiency Analysis: Comparing NVIDIA Corporation and Seagate Technology Holdings plc
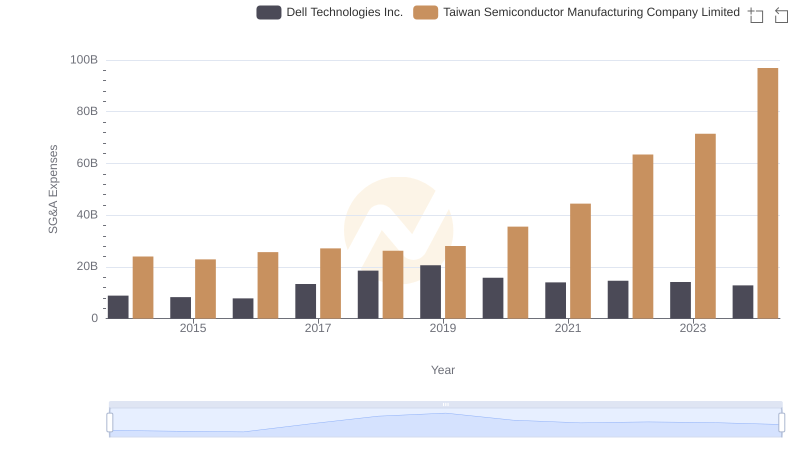
Taiwan Semiconductor Manufacturing Company Limited vs Dell Technologies Inc.: SG&A Expense Trends
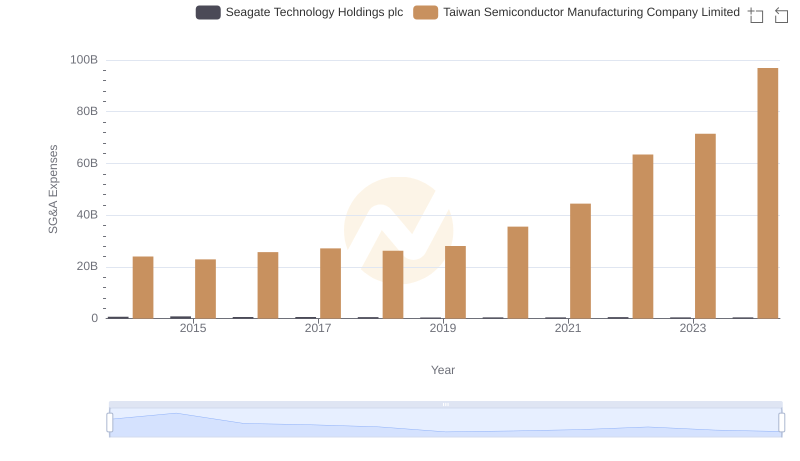
Taiwan Semiconductor Manufacturing Company Limited and Seagate Technology Holdings plc: SG&A Spending Patterns Compared
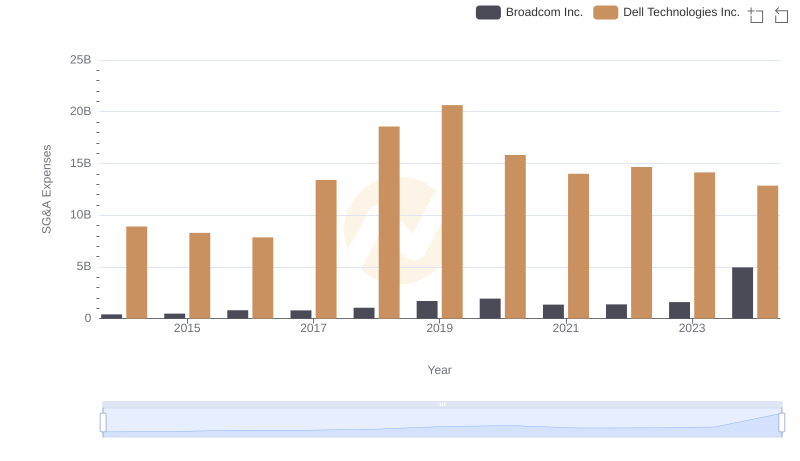
Broadcom Inc. or Dell Technologies Inc.: Who Manages SG&A Costs Better?
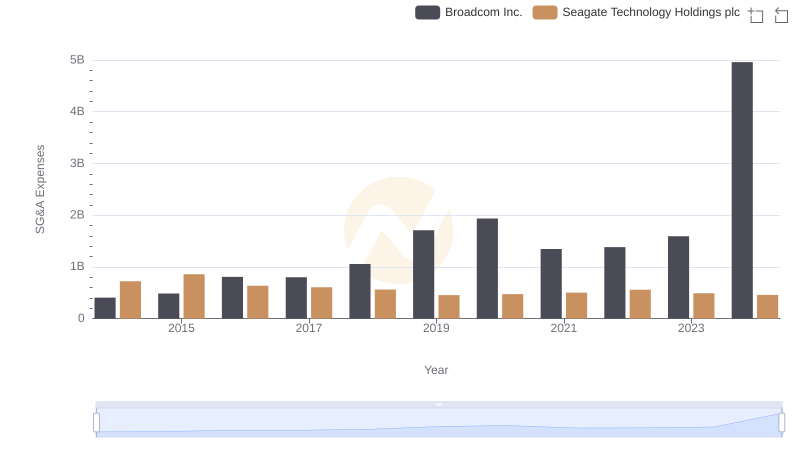
Who Optimizes SG&A Costs Better? Broadcom Inc. or Seagate Technology Holdings plc
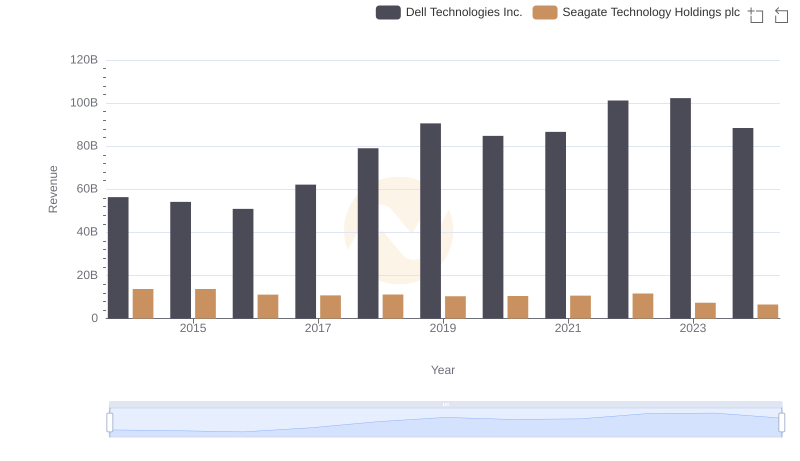
Dell Technologies Inc. and Seagate Technology Holdings plc: A Comprehensive Revenue Analysis
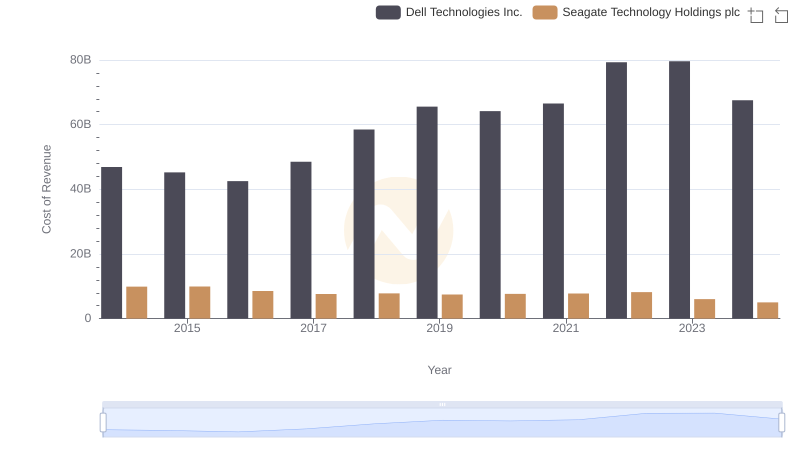
Cost of Revenue Trends: Dell Technologies Inc. vs Seagate Technology Holdings plc
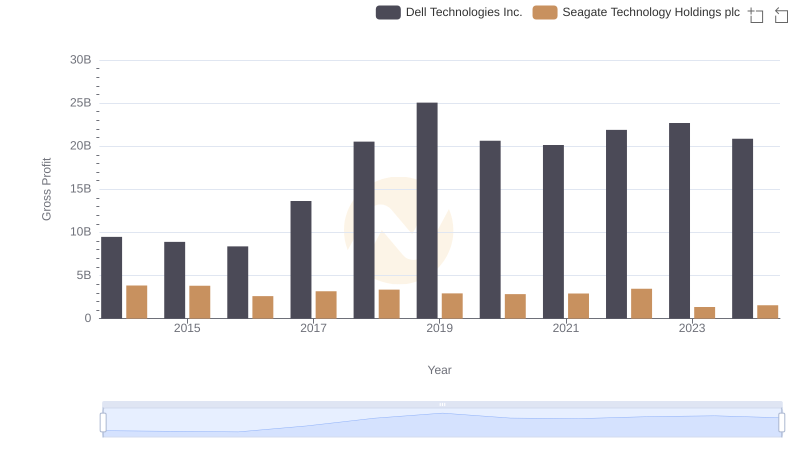
Dell Technologies Inc. vs Seagate Technology Holdings plc: A Gross Profit Performance Breakdown
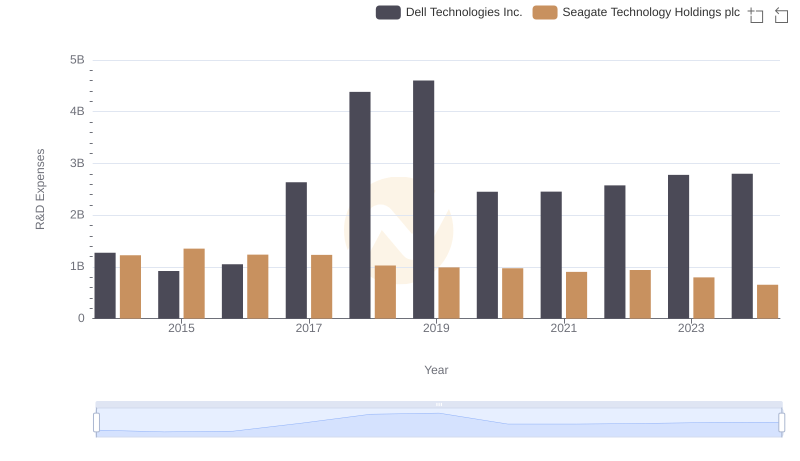
Comparing Innovation Spending: Dell Technologies Inc. and Seagate Technology Holdings plc
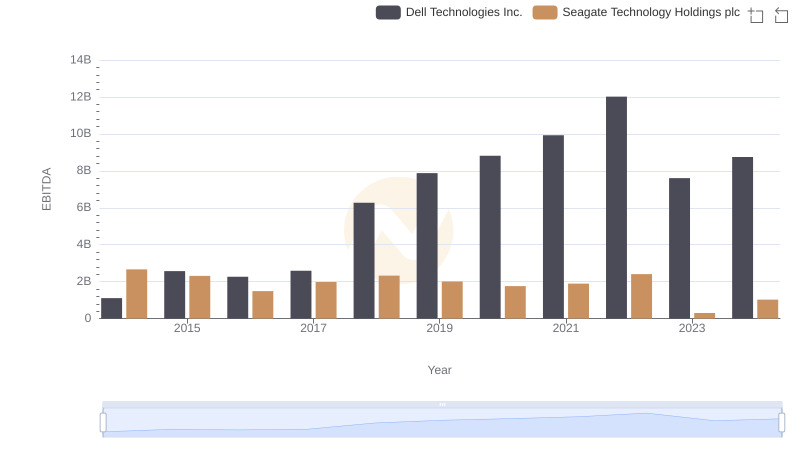
EBITDA Analysis: Evaluating Dell Technologies Inc. Against Seagate Technology Holdings plc