| __timestamp | Dell Technologies Inc. | Seagate Technology Holdings plc |
|---|---|---|
| Wednesday, January 1, 2014 | 9485000000 | 3846000000 |
| Thursday, January 1, 2015 | 8896000000 | 3809000000 |
| Friday, January 1, 2016 | 8387000000 | 2615000000 |
| Sunday, January 1, 2017 | 13649000000 | 3174000000 |
| Monday, January 1, 2018 | 20537000000 | 3364000000 |
| Tuesday, January 1, 2019 | 25053000000 | 2932000000 |
| Wednesday, January 1, 2020 | 20639000000 | 2842000000 |
| Friday, January 1, 2021 | 20140000000 | 2917000000 |
| Saturday, January 1, 2022 | 21891000000 | 3469000000 |
| Sunday, January 1, 2023 | 22686000000 | 1351000000 |
| Monday, January 1, 2024 | 20869000000 | 1546000000 |
Data in motion
In the ever-evolving landscape of technology, Dell Technologies Inc. and Seagate Technology Holdings plc have carved distinct paths in their financial journeys. From 2014 to 2024, Dell's gross profit has shown a remarkable upward trajectory, peaking in 2019 with a 165% increase from its 2014 figures. This growth underscores Dell's strategic prowess in adapting to market demands and expanding its product offerings.
Conversely, Seagate's performance paints a different picture. Despite a strong start in 2014, Seagate's gross profit has experienced fluctuations, with a notable decline in 2023, dropping by 65% compared to its 2014 performance. This trend highlights the challenges faced by Seagate in maintaining its market position amidst fierce competition and technological shifts.
As we look to the future, the contrasting financial narratives of these two giants offer valuable insights into the dynamics of the tech industry.
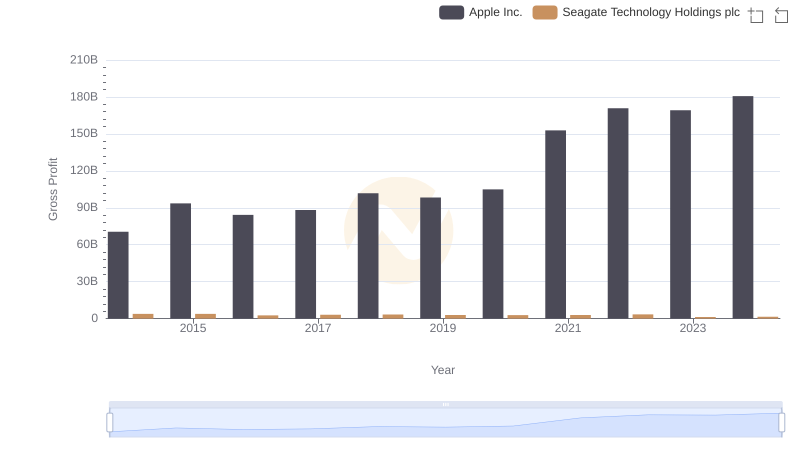
Apple Inc. vs Seagate Technology Holdings plc: A Gross Profit Performance Breakdown
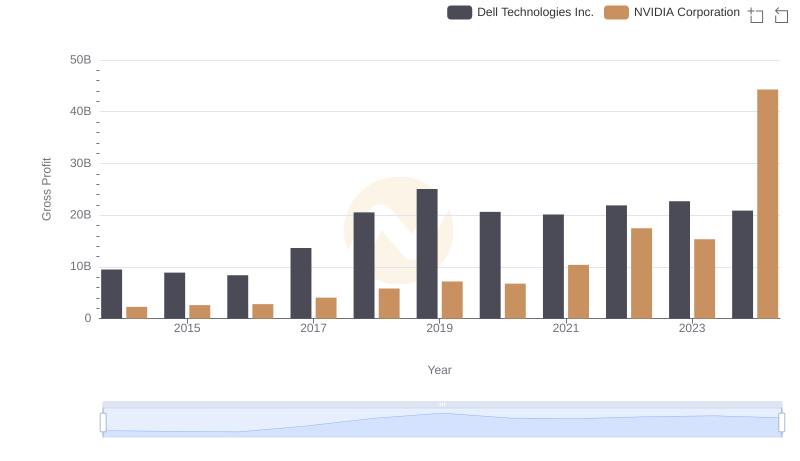
Key Insights on Gross Profit: NVIDIA Corporation vs Dell Technologies Inc.
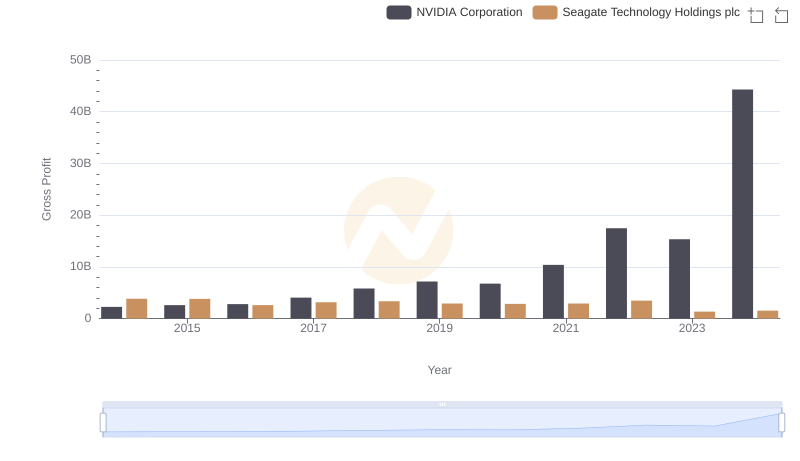
Gross Profit Analysis: Comparing NVIDIA Corporation and Seagate Technology Holdings plc
Key Insights on Gross Profit: Taiwan Semiconductor Manufacturing Company Limited vs Dell Technologies Inc.
Gross Profit Trends Compared: Taiwan Semiconductor Manufacturing Company Limited vs Seagate Technology Holdings plc
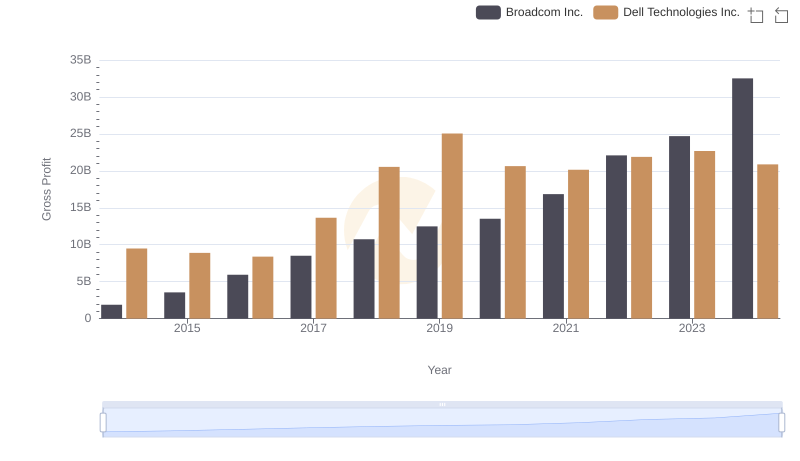
Broadcom Inc. and Dell Technologies Inc.: A Detailed Gross Profit Analysis
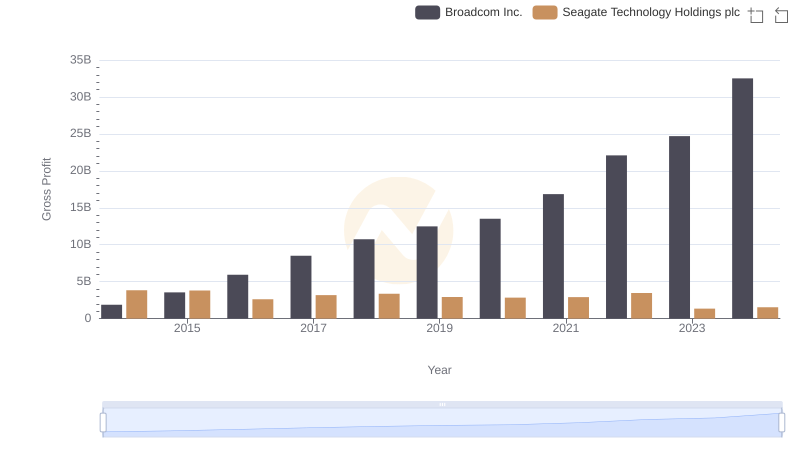
Gross Profit Trends Compared: Broadcom Inc. vs Seagate Technology Holdings plc
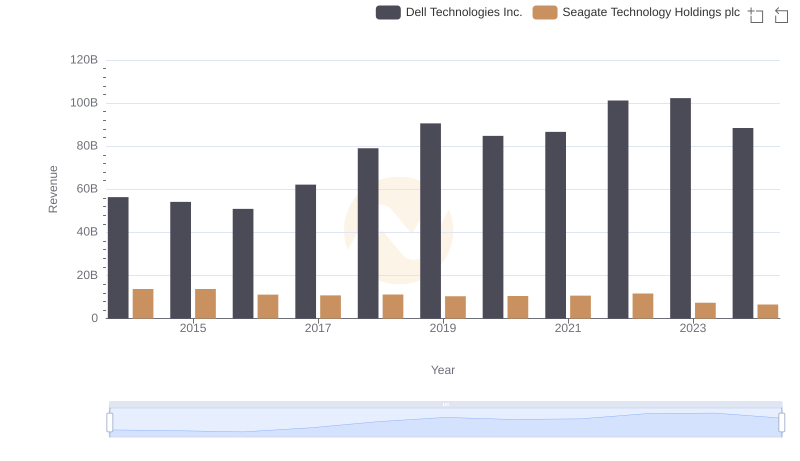
Dell Technologies Inc. and Seagate Technology Holdings plc: A Comprehensive Revenue Analysis
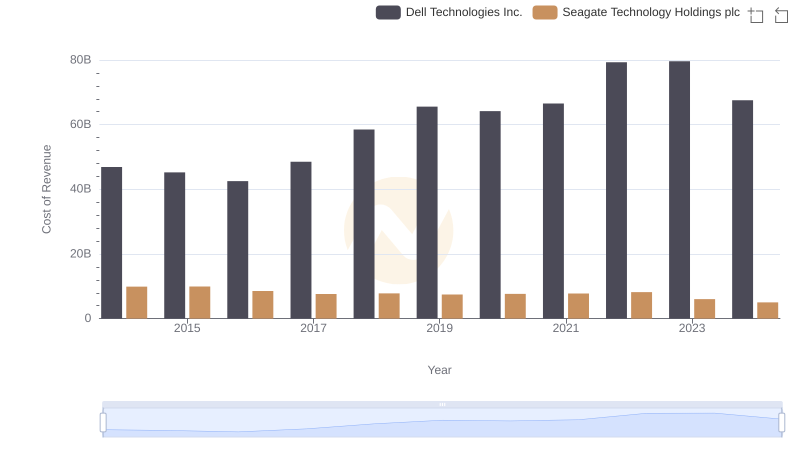
Cost of Revenue Trends: Dell Technologies Inc. vs Seagate Technology Holdings plc
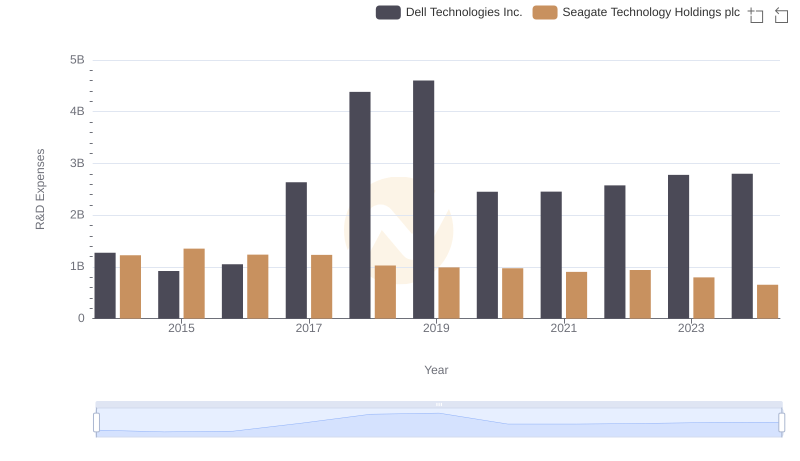
Comparing Innovation Spending: Dell Technologies Inc. and Seagate Technology Holdings plc
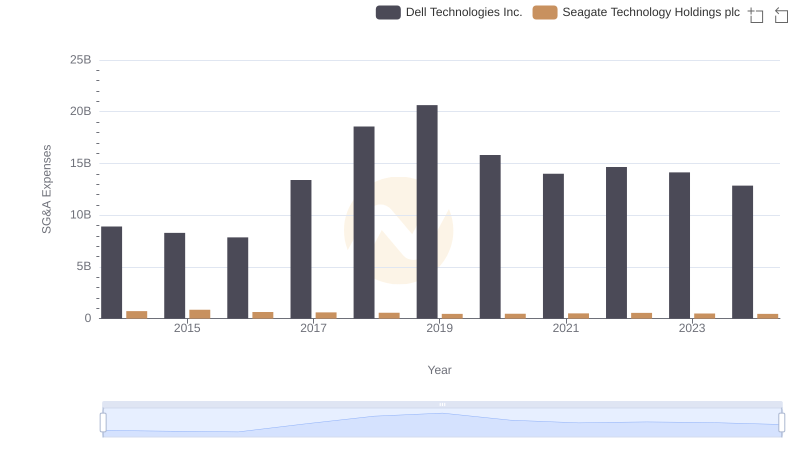
Cost Management Insights: SG&A Expenses for Dell Technologies Inc. and Seagate Technology Holdings plc
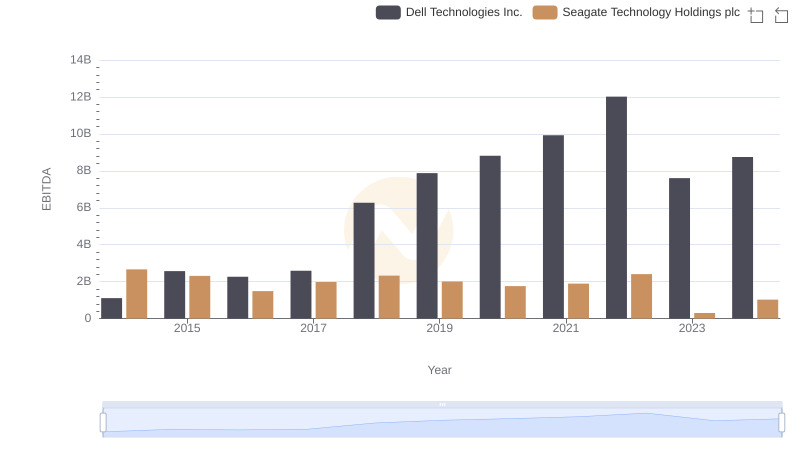
EBITDA Analysis: Evaluating Dell Technologies Inc. Against Seagate Technology Holdings plc