| __timestamp | Dell Technologies Inc. | Seagate Technology Holdings plc |
|---|---|---|
| Wednesday, January 1, 2014 | 1108000000 | 2665000000 |
| Thursday, January 1, 2015 | 2569000000 | 2312000000 |
| Friday, January 1, 2016 | 2266000000 | 1488000000 |
| Sunday, January 1, 2017 | 2591000000 | 1981000000 |
| Monday, January 1, 2018 | 6271000000 | 2328000000 |
| Tuesday, January 1, 2019 | 7873000000 | 2006000000 |
| Wednesday, January 1, 2020 | 8814000000 | 1761000000 |
| Friday, January 1, 2021 | 9925000000 | 1897000000 |
| Saturday, January 1, 2022 | 12016000000 | 2409000000 |
| Sunday, January 1, 2023 | 7603000000 | 301000000 |
| Monday, January 1, 2024 | 8746000000 | 1030000000 |
Cracking the code
In the ever-evolving tech industry, understanding financial health is crucial. This analysis delves into the EBITDA performance of Dell Technologies Inc. and Seagate Technology Holdings plc from 2014 to 2024. Over this decade, Dell has shown a remarkable growth trajectory, with its EBITDA increasing by over 700% from 2014 to 2022, peaking at approximately $12 billion. In contrast, Seagate's EBITDA has remained relatively stable, with a slight decline of around 10% over the same period, highlighting different strategic paths.
Dell's aggressive expansion and diversification strategies have paid off, especially noticeable in the 2018-2022 period, where its EBITDA surged by nearly 90%. Meanwhile, Seagate's focus on data storage solutions has kept its EBITDA consistent, albeit with less dramatic growth. This comparison underscores the diverse strategies and market positions of these tech giants.
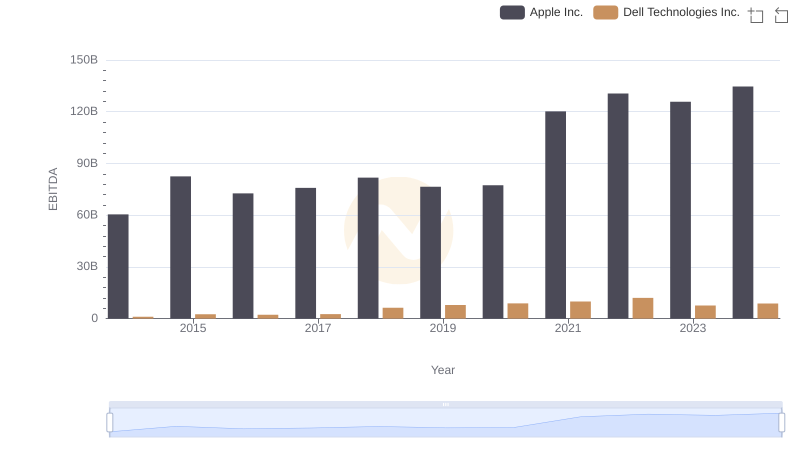
EBITDA Analysis: Evaluating Apple Inc. Against Dell Technologies Inc.
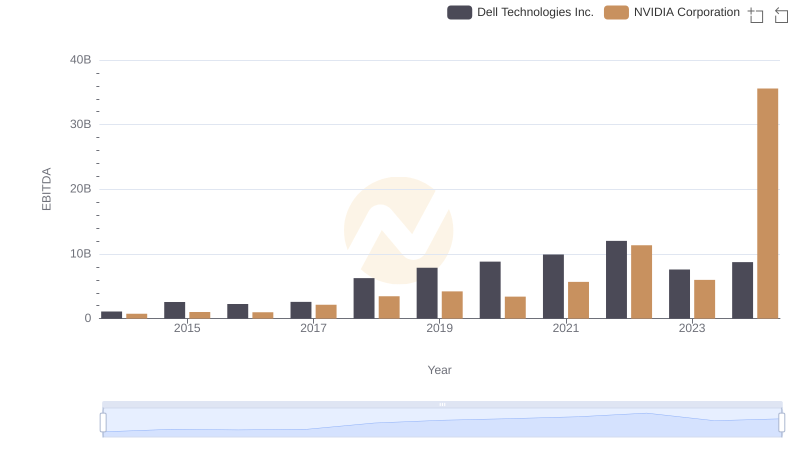
EBITDA Analysis: Evaluating NVIDIA Corporation Against Dell Technologies Inc.
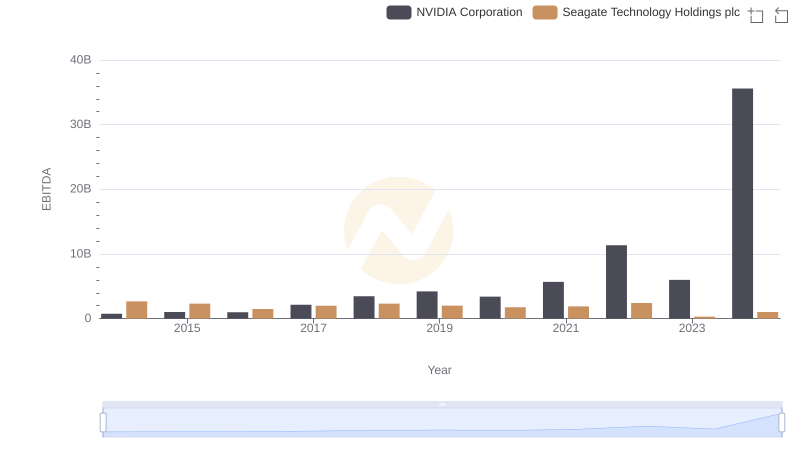
A Side-by-Side Analysis of EBITDA: NVIDIA Corporation and Seagate Technology Holdings plc
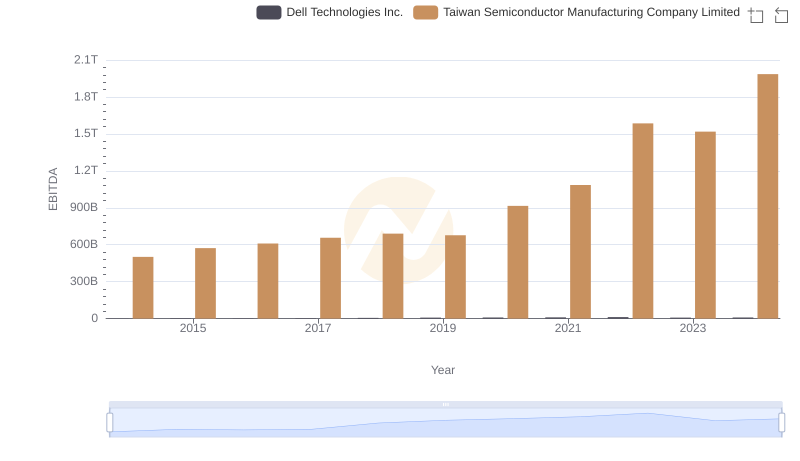
EBITDA Performance Review: Taiwan Semiconductor Manufacturing Company Limited vs Dell Technologies Inc.
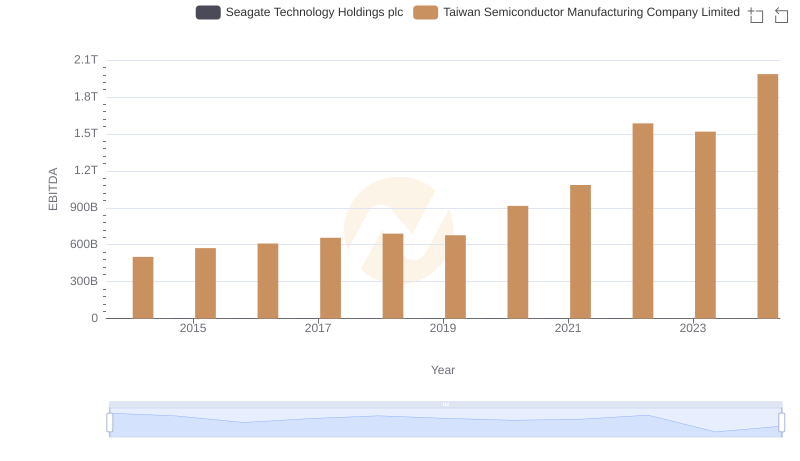
A Side-by-Side Analysis of EBITDA: Taiwan Semiconductor Manufacturing Company Limited and Seagate Technology Holdings plc
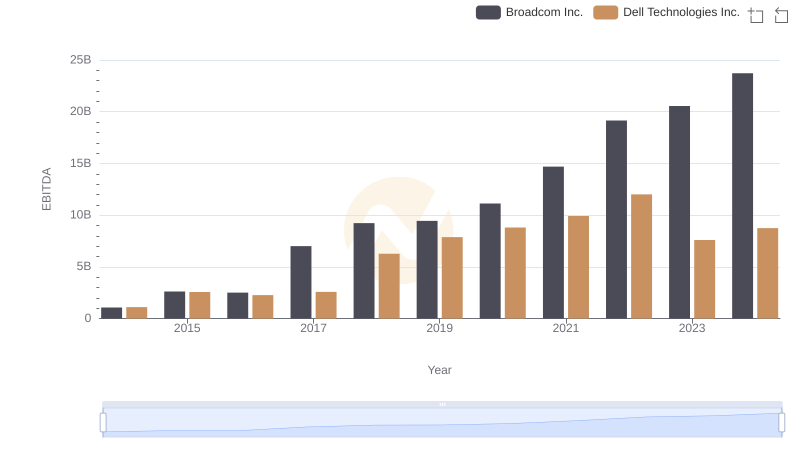
Broadcom Inc. vs Dell Technologies Inc.: In-Depth EBITDA Performance Comparison
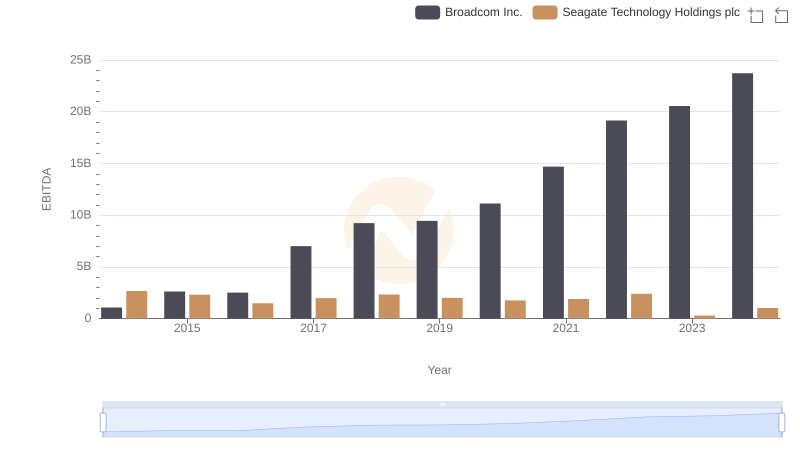
Comparative EBITDA Analysis: Broadcom Inc. vs Seagate Technology Holdings plc
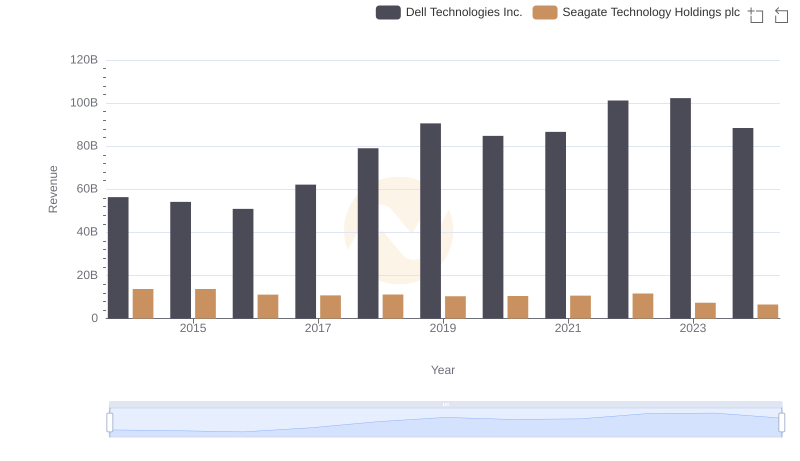
Dell Technologies Inc. and Seagate Technology Holdings plc: A Comprehensive Revenue Analysis
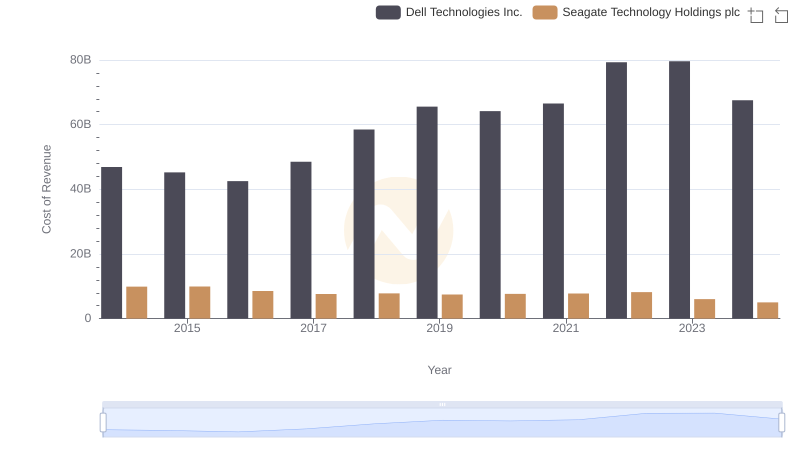
Cost of Revenue Trends: Dell Technologies Inc. vs Seagate Technology Holdings plc
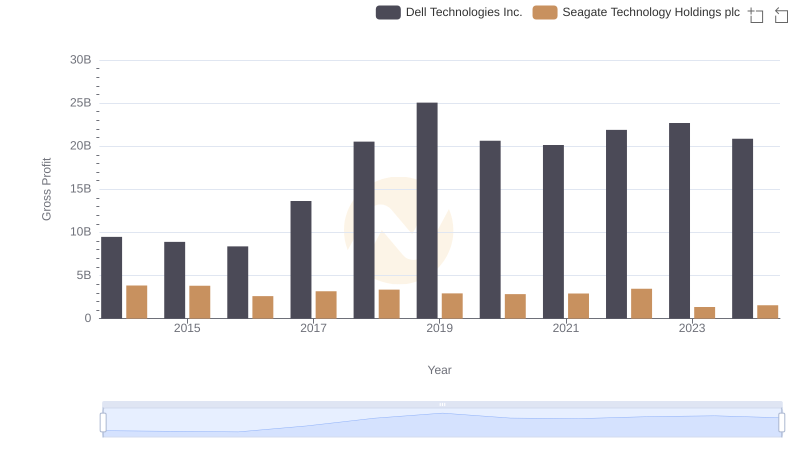
Dell Technologies Inc. vs Seagate Technology Holdings plc: A Gross Profit Performance Breakdown
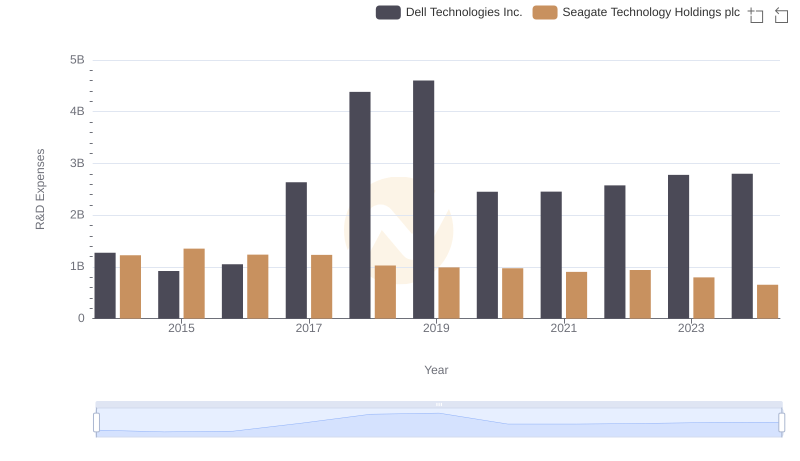
Comparing Innovation Spending: Dell Technologies Inc. and Seagate Technology Holdings plc
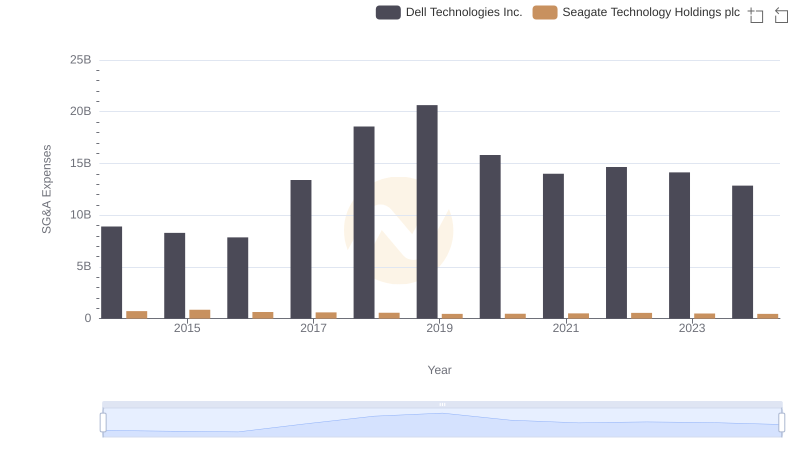
Cost Management Insights: SG&A Expenses for Dell Technologies Inc. and Seagate Technology Holdings plc