| __timestamp | Dell Technologies Inc. | Seagate Technology Holdings plc |
|---|---|---|
| Wednesday, January 1, 2014 | 56377000000 | 13724000000 |
| Thursday, January 1, 2015 | 54142000000 | 13739000000 |
| Friday, January 1, 2016 | 50911000000 | 11160000000 |
| Sunday, January 1, 2017 | 62164000000 | 10771000000 |
| Monday, January 1, 2018 | 79040000000 | 11184000000 |
| Tuesday, January 1, 2019 | 90621000000 | 10390000000 |
| Wednesday, January 1, 2020 | 84815000000 | 10509000000 |
| Friday, January 1, 2021 | 86670000000 | 10681000000 |
| Saturday, January 1, 2022 | 101197000000 | 11661000000 |
| Sunday, January 1, 2023 | 102301000000 | 7384000000 |
| Monday, January 1, 2024 | 88425000000 | 6551000000 |
Unveiling the hidden dimensions of data
In the ever-evolving tech industry, revenue growth is a key indicator of a company's success. From 2014 to 2024, Dell Technologies Inc. and Seagate Technology Holdings plc have shown contrasting revenue trajectories. Dell's revenue surged by approximately 57% over this period, peaking in 2023, while Seagate's revenue experienced a decline of around 52%, with a notable drop in 2023. This divergence highlights Dell's robust market strategies and adaptability, whereas Seagate faces challenges in maintaining its market share. The data underscores the importance of innovation and strategic planning in the tech sector. As we look to the future, these trends offer valuable insights into the competitive dynamics between hardware giants and the shifting landscape of technology consumption.
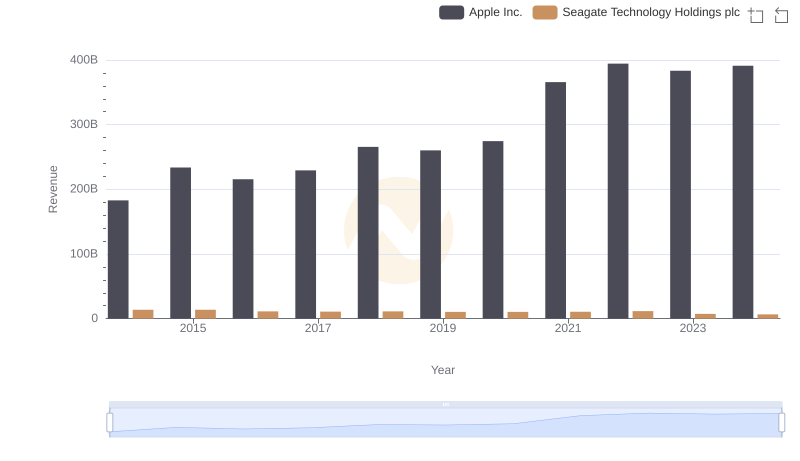
Annual Revenue Comparison: Apple Inc. vs Seagate Technology Holdings plc
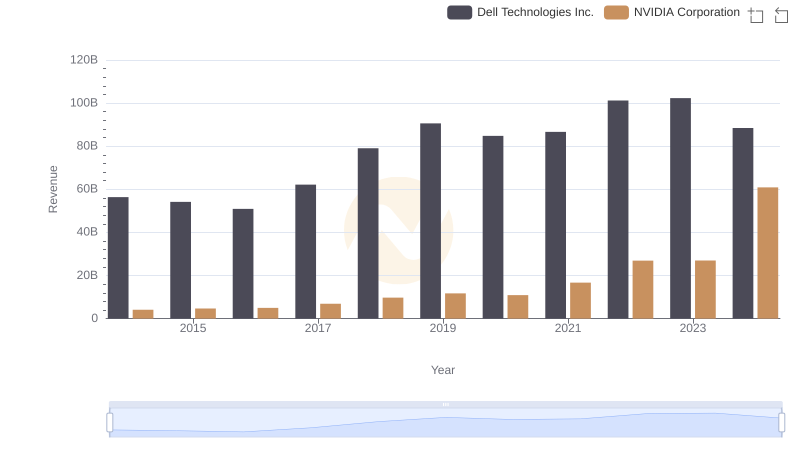
Annual Revenue Comparison: NVIDIA Corporation vs Dell Technologies Inc.
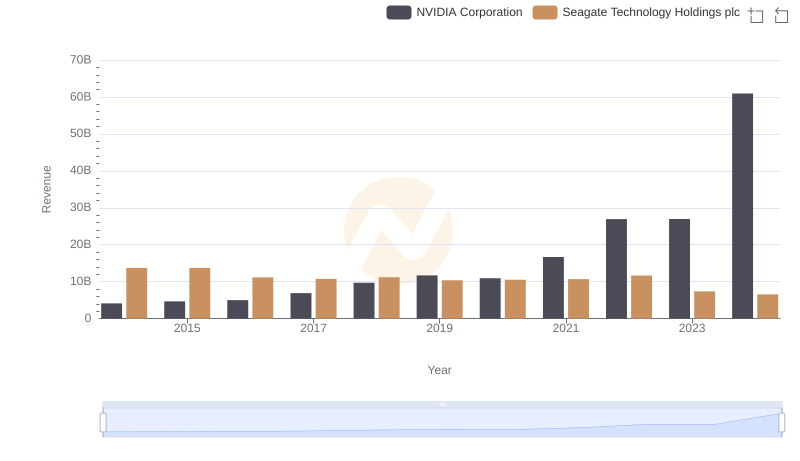
Comparing Revenue Performance: NVIDIA Corporation or Seagate Technology Holdings plc?
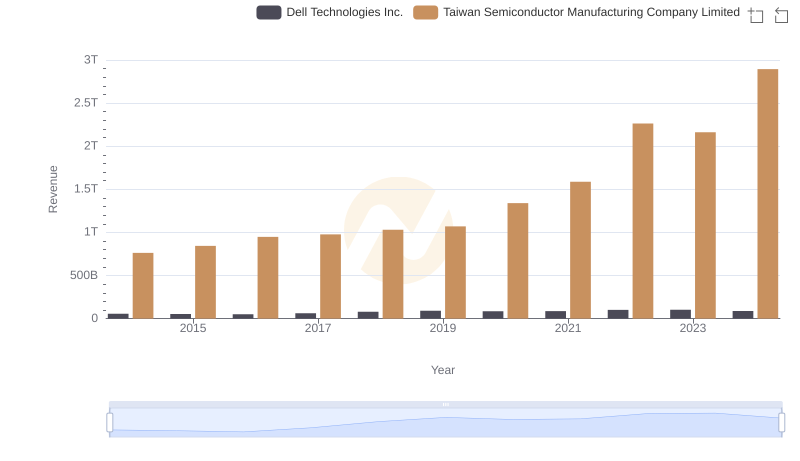
Revenue Insights: Taiwan Semiconductor Manufacturing Company Limited and Dell Technologies Inc. Performance Compared
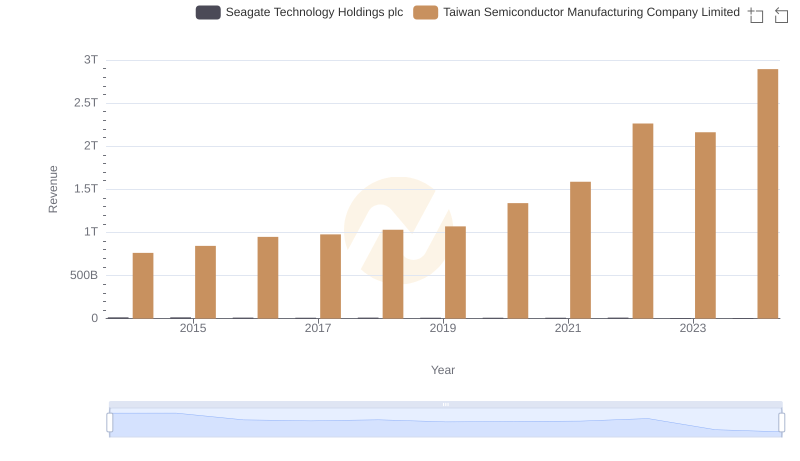
Revenue Insights: Taiwan Semiconductor Manufacturing Company Limited and Seagate Technology Holdings plc Performance Compared
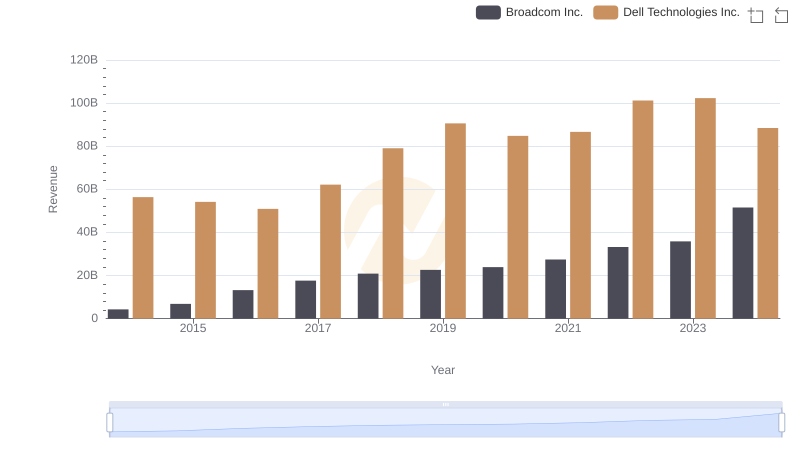
Annual Revenue Comparison: Broadcom Inc. vs Dell Technologies Inc.
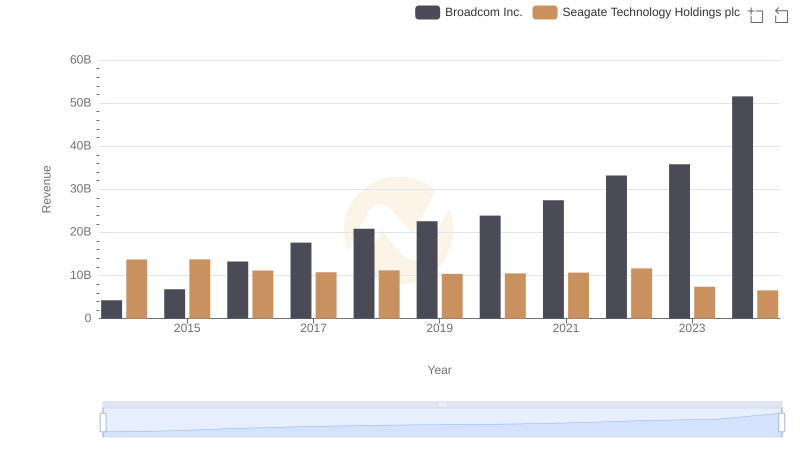
Comparing Revenue Performance: Broadcom Inc. or Seagate Technology Holdings plc?
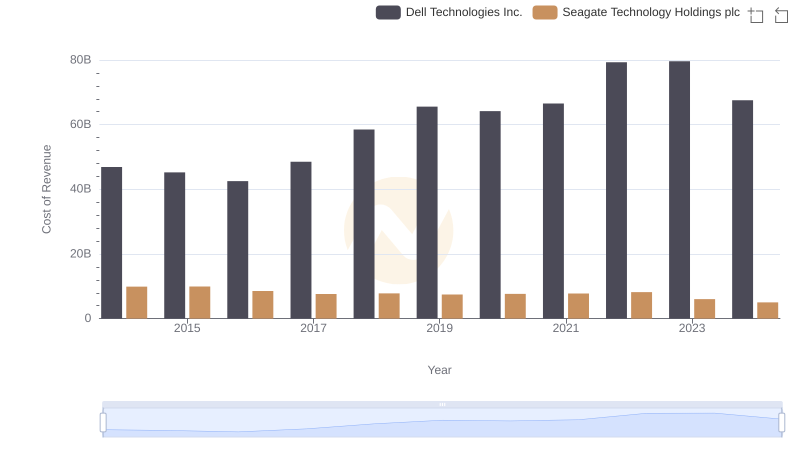
Cost of Revenue Trends: Dell Technologies Inc. vs Seagate Technology Holdings plc
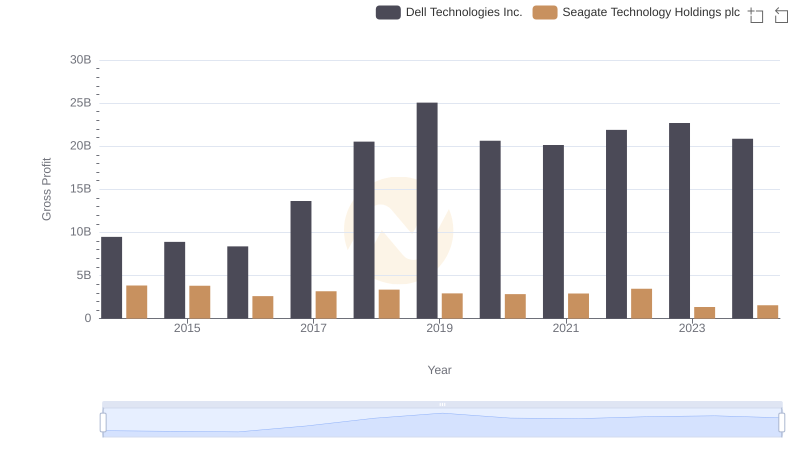
Dell Technologies Inc. vs Seagate Technology Holdings plc: A Gross Profit Performance Breakdown
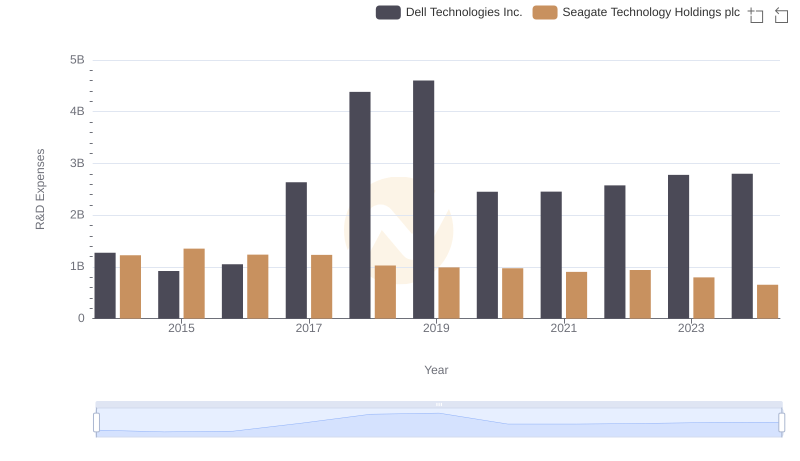
Comparing Innovation Spending: Dell Technologies Inc. and Seagate Technology Holdings plc
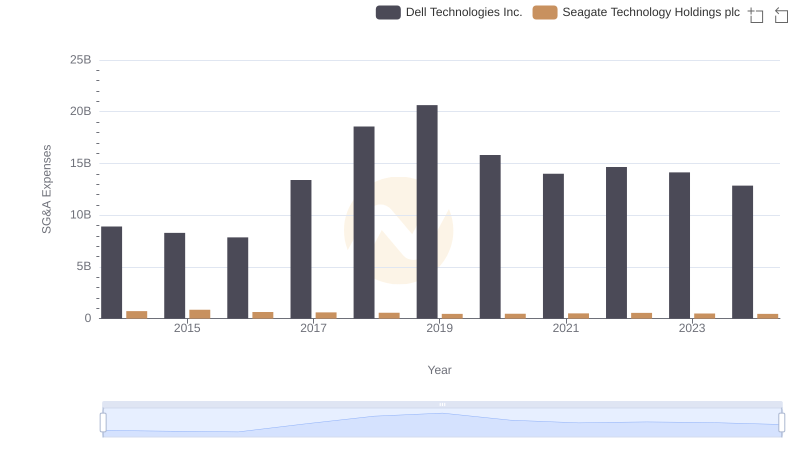
Cost Management Insights: SG&A Expenses for Dell Technologies Inc. and Seagate Technology Holdings plc
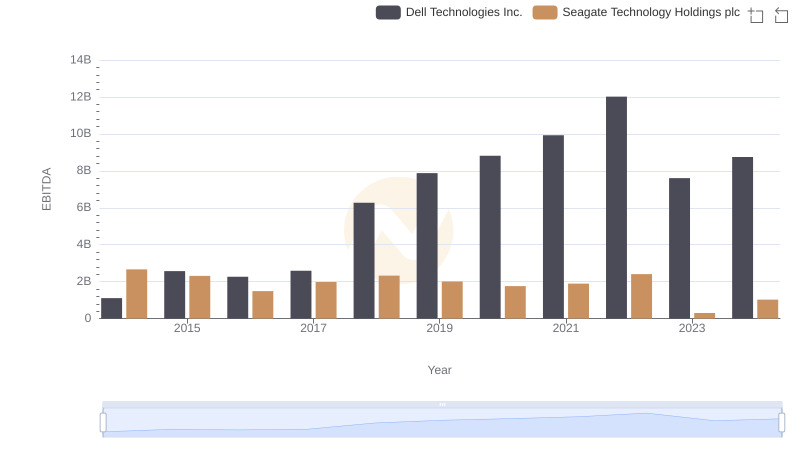
EBITDA Analysis: Evaluating Dell Technologies Inc. Against Seagate Technology Holdings plc