| __timestamp | Dell Technologies Inc. | Seagate Technology Holdings plc |
|---|---|---|
| Wednesday, January 1, 2014 | 46892000000 | 9878000000 |
| Thursday, January 1, 2015 | 45246000000 | 9930000000 |
| Friday, January 1, 2016 | 42524000000 | 8545000000 |
| Sunday, January 1, 2017 | 48515000000 | 7597000000 |
| Monday, January 1, 2018 | 58503000000 | 7820000000 |
| Tuesday, January 1, 2019 | 65568000000 | 7458000000 |
| Wednesday, January 1, 2020 | 64176000000 | 7667000000 |
| Friday, January 1, 2021 | 66530000000 | 7764000000 |
| Saturday, January 1, 2022 | 79306000000 | 8192000000 |
| Sunday, January 1, 2023 | 79615000000 | 6033000000 |
| Monday, January 1, 2024 | 67556000000 | 5005000000 |
Igniting the spark of knowledge
In the ever-evolving tech industry, understanding cost dynamics is crucial. Dell Technologies Inc. and Seagate Technology Holdings plc, two giants in the sector, have shown contrasting trends in their cost of revenue from 2014 to 2024. Dell's cost of revenue surged by approximately 70% from 2014 to 2023, peaking in 2023 before a slight dip in 2024. This reflects Dell's aggressive expansion and scaling strategies. In contrast, Seagate's cost of revenue decreased by nearly 50% over the same period, indicating a strategic shift towards efficiency and cost management. The year 2023 marked a significant divergence, with Dell's costs reaching their zenith, while Seagate's costs plummeted. These trends highlight the differing strategic priorities of these tech titans, with Dell focusing on growth and Seagate on optimization. As the tech landscape continues to shift, these cost trends offer valuable insights into the operational strategies of leading companies.
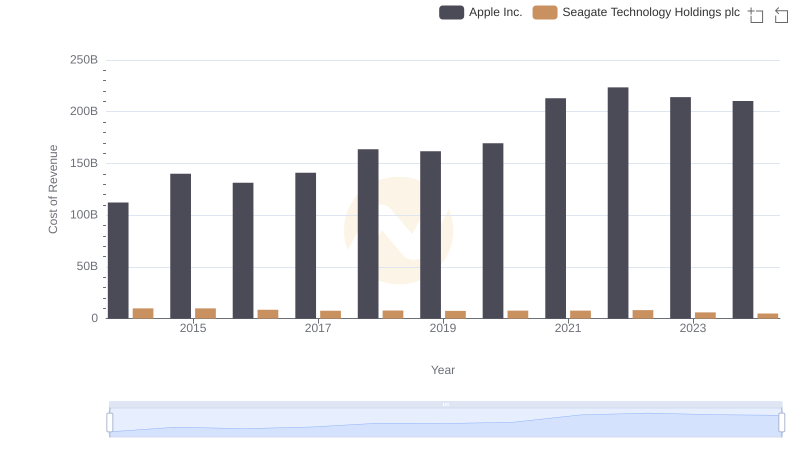
Comparing Cost of Revenue Efficiency: Apple Inc. vs Seagate Technology Holdings plc
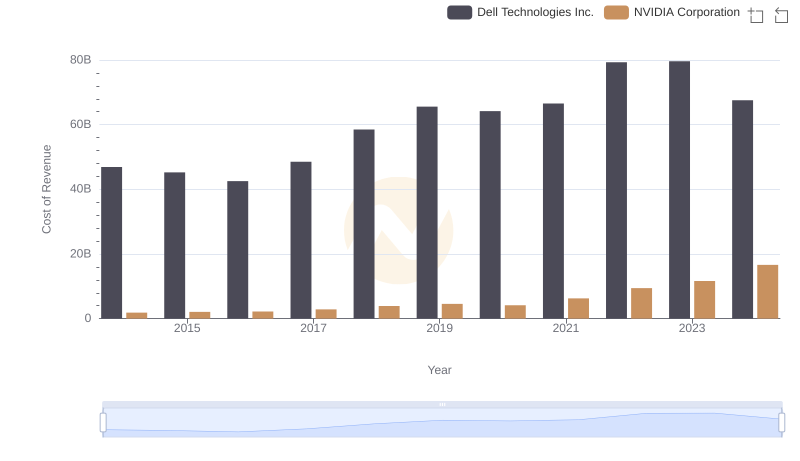
NVIDIA Corporation vs Dell Technologies Inc.: Efficiency in Cost of Revenue Explored
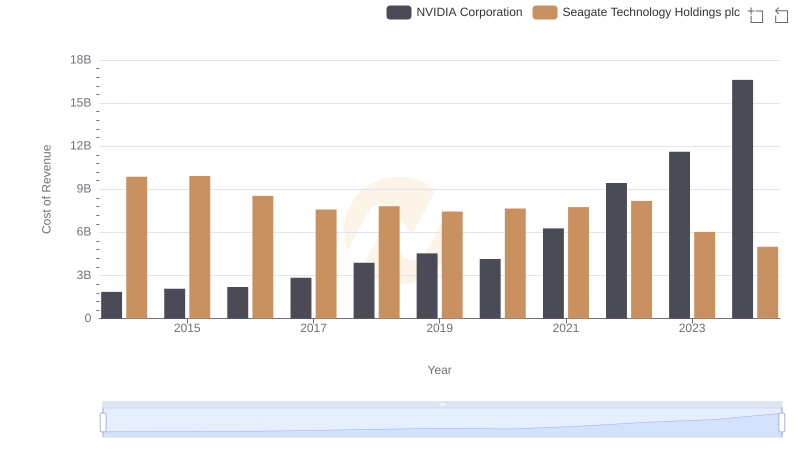
Cost of Revenue Comparison: NVIDIA Corporation vs Seagate Technology Holdings plc
Cost of Revenue Trends: Taiwan Semiconductor Manufacturing Company Limited vs Dell Technologies Inc.
Cost of Revenue: Key Insights for Taiwan Semiconductor Manufacturing Company Limited and Seagate Technology Holdings plc
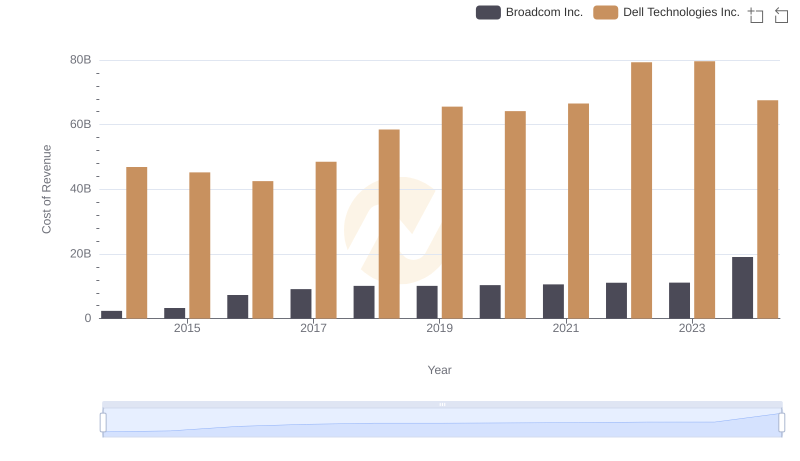
Cost Insights: Breaking Down Broadcom Inc. and Dell Technologies Inc.'s Expenses
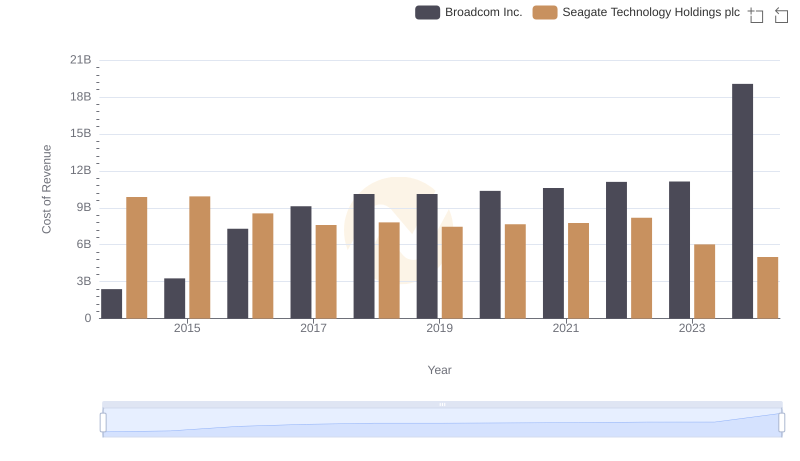
Cost of Revenue Comparison: Broadcom Inc. vs Seagate Technology Holdings plc
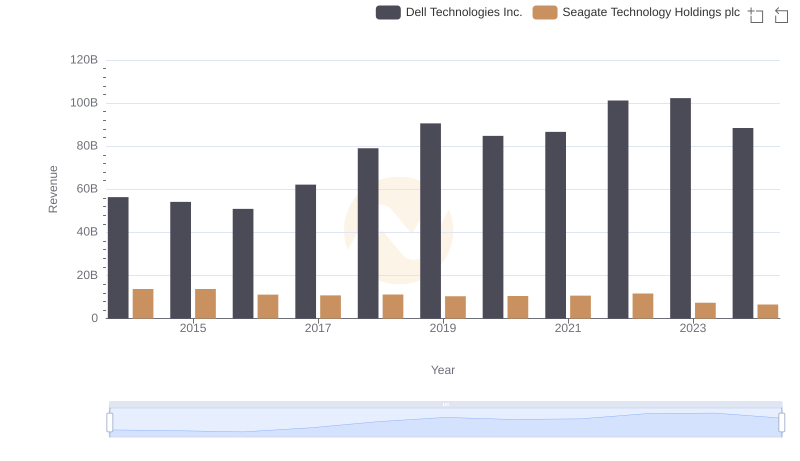
Dell Technologies Inc. and Seagate Technology Holdings plc: A Comprehensive Revenue Analysis
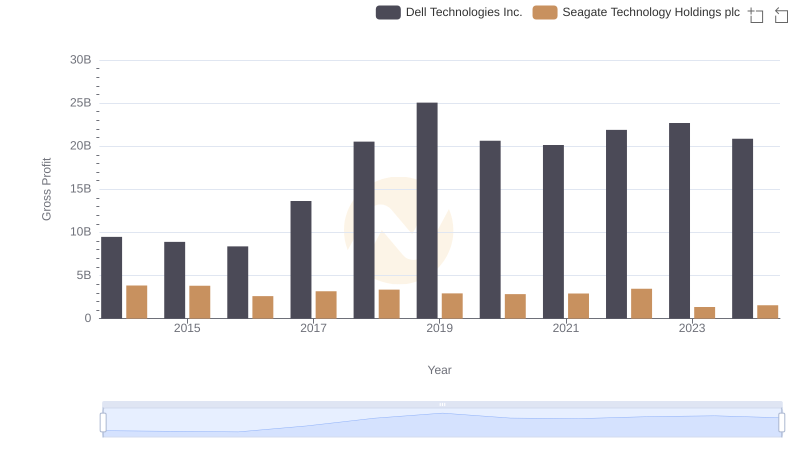
Dell Technologies Inc. vs Seagate Technology Holdings plc: A Gross Profit Performance Breakdown
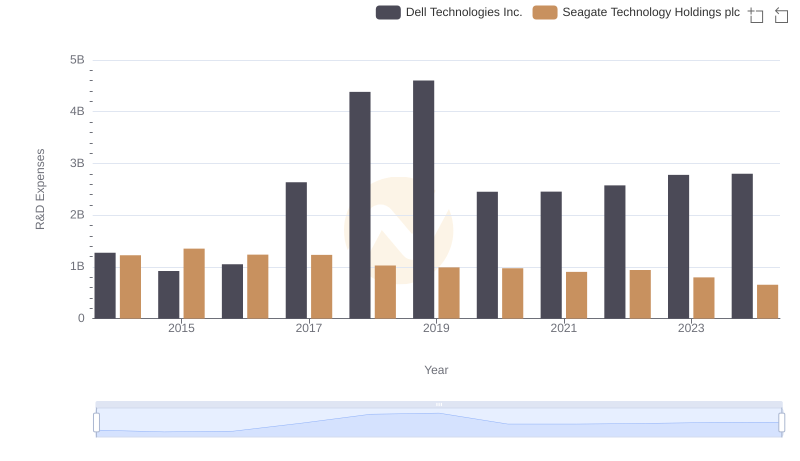
Comparing Innovation Spending: Dell Technologies Inc. and Seagate Technology Holdings plc
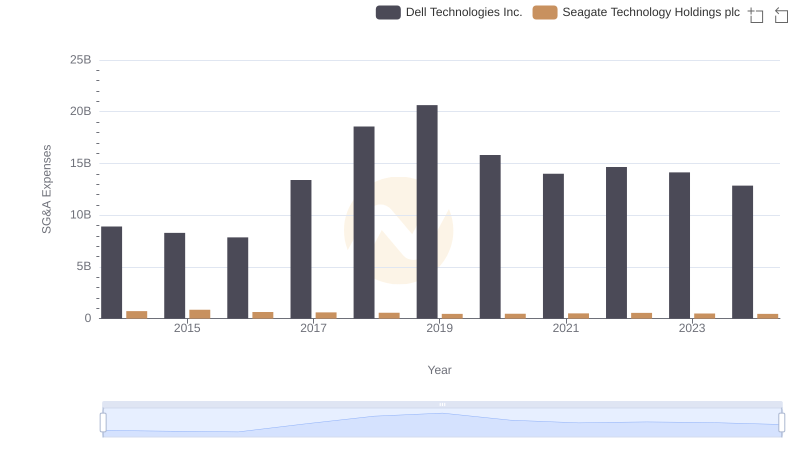
Cost Management Insights: SG&A Expenses for Dell Technologies Inc. and Seagate Technology Holdings plc
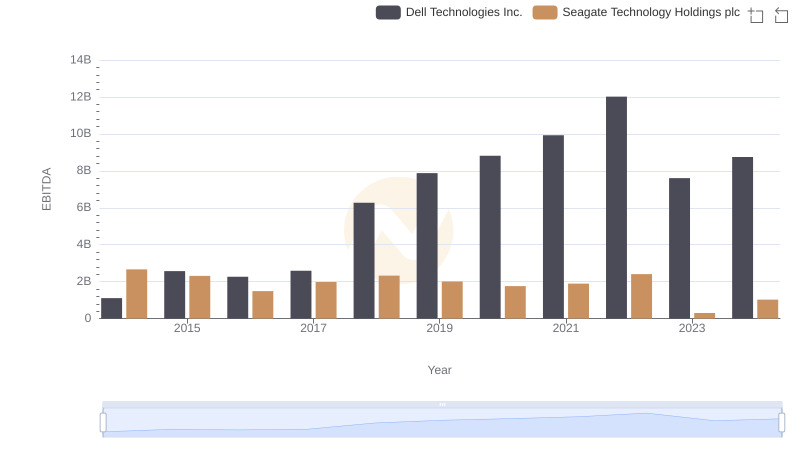
EBITDA Analysis: Evaluating Dell Technologies Inc. Against Seagate Technology Holdings plc