| __timestamp | Eaton Corporation plc | The Boeing Company |
|---|---|---|
| Wednesday, January 1, 2014 | 15646000000 | 76752000000 |
| Thursday, January 1, 2015 | 14292000000 | 82088000000 |
| Friday, January 1, 2016 | 13400000000 | 80790000000 |
| Sunday, January 1, 2017 | 13756000000 | 76066000000 |
| Monday, January 1, 2018 | 14511000000 | 81490000000 |
| Tuesday, January 1, 2019 | 14338000000 | 72093000000 |
| Wednesday, January 1, 2020 | 12408000000 | 63843000000 |
| Friday, January 1, 2021 | 13293000000 | 59237000000 |
| Saturday, January 1, 2022 | 13865000000 | 63078000000 |
| Sunday, January 1, 2023 | 14763000000 | 70070000000 |
| Monday, January 1, 2024 | 15375000000 | 68508000000 |
Data in motion
In the ever-evolving landscape of aerospace and industrial manufacturing, understanding cost structures is crucial. This analysis delves into the cost of revenue for The Boeing Company and Eaton Corporation plc from 2014 to 2023. Boeing, a titan in aerospace, saw its cost of revenue peak in 2015, with a gradual decline thereafter, hitting a low in 2021. This reflects a 23% reduction from its 2015 high, likely influenced by global economic shifts and industry-specific challenges. Conversely, Eaton, a leader in power management, maintained a more stable cost structure, with fluctuations within a 10% range over the same period. Notably, Eaton's cost of revenue dipped in 2020, aligning with global economic disruptions, but rebounded by 2023. Missing data for 2024 suggests ongoing adjustments. This comparative insight highlights the resilience and adaptability of these industry giants in managing their expenses.
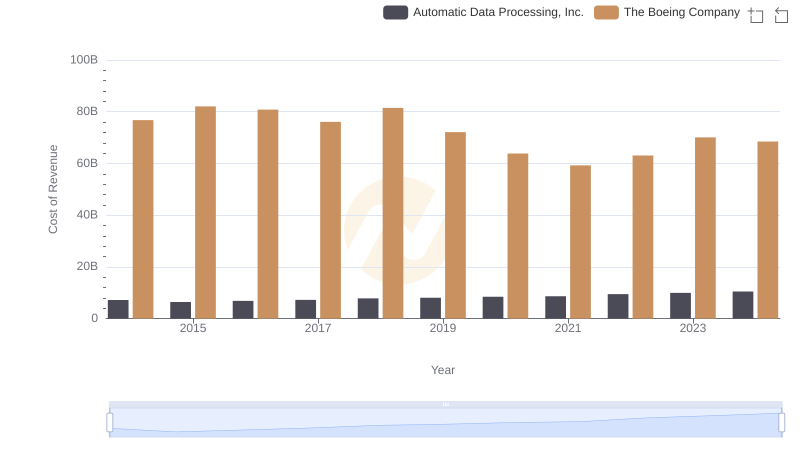
Analyzing Cost of Revenue: The Boeing Company and Automatic Data Processing, Inc.
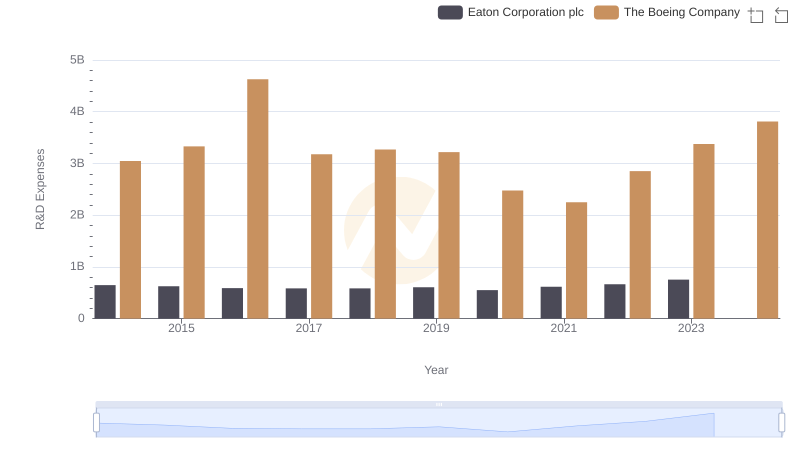
The Boeing Company vs Eaton Corporation plc: Strategic Focus on R&D Spending
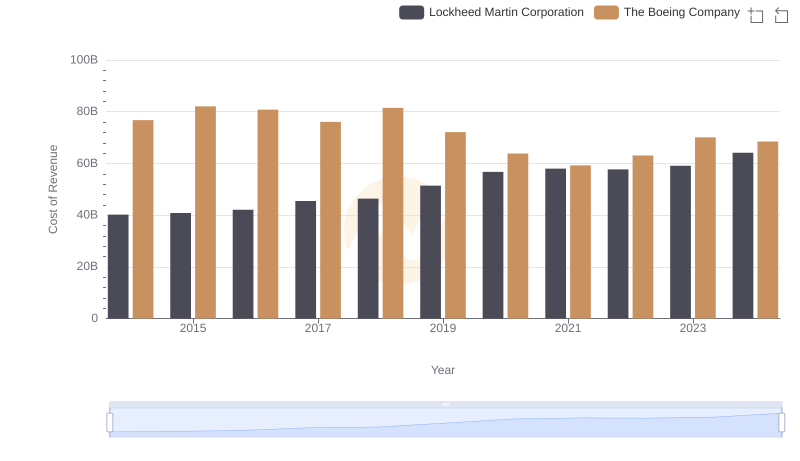
Cost Insights: Breaking Down The Boeing Company and Lockheed Martin Corporation's Expenses
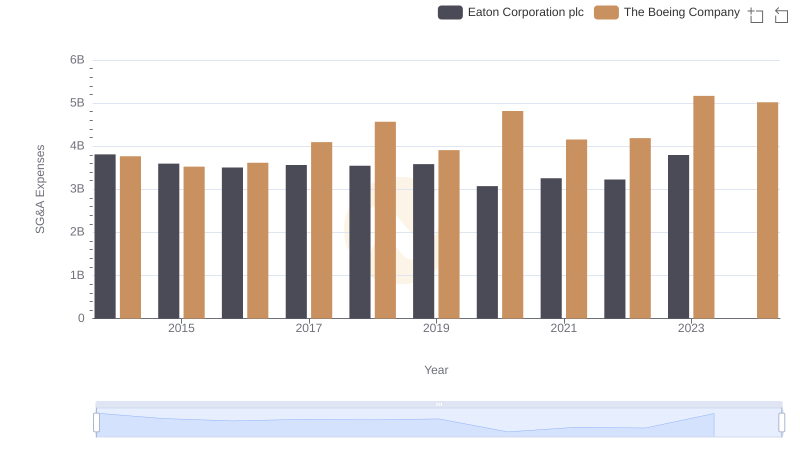
Selling, General, and Administrative Costs: The Boeing Company vs Eaton Corporation plc
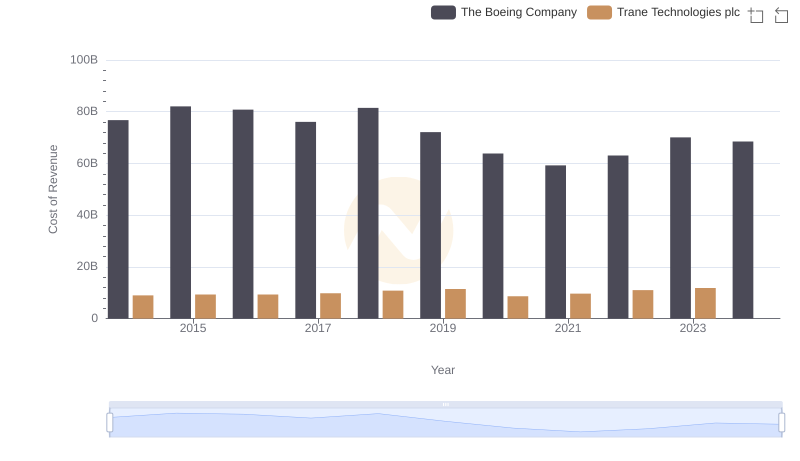
Comparing Cost of Revenue Efficiency: The Boeing Company vs Trane Technologies plc

Cost of Revenue Comparison: The Boeing Company vs 3M Company
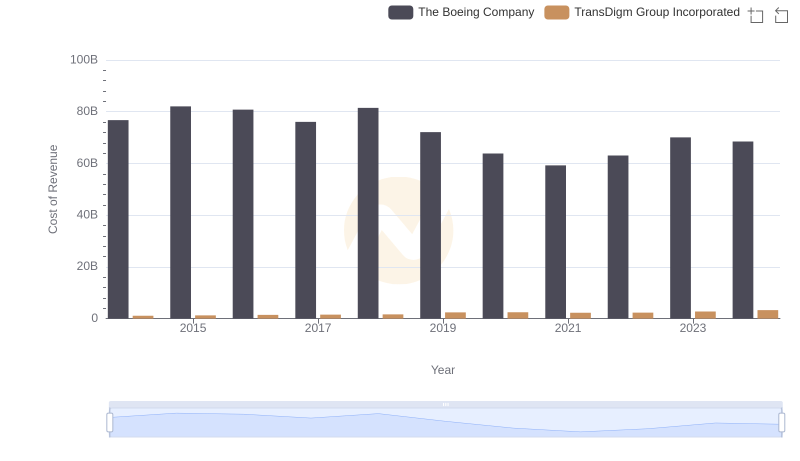
Cost of Revenue Trends: The Boeing Company vs TransDigm Group Incorporated