| __timestamp | Booz Allen Hamilton Holding Corporation | Eaton Corporation plc |
|---|---|---|
| Wednesday, January 1, 2014 | 2716113000 | 15646000000 |
| Thursday, January 1, 2015 | 2593849000 | 14292000000 |
| Friday, January 1, 2016 | 2580026000 | 13400000000 |
| Sunday, January 1, 2017 | 2691982000 | 13756000000 |
| Monday, January 1, 2018 | 2867103000 | 14511000000 |
| Tuesday, January 1, 2019 | 3100466000 | 14338000000 |
| Wednesday, January 1, 2020 | 3379180000 | 12408000000 |
| Friday, January 1, 2021 | 3657530000 | 13293000000 |
| Saturday, January 1, 2022 | 3899622000 | 13865000000 |
| Sunday, January 1, 2023 | 4304810000 | 14763000000 |
| Monday, January 1, 2024 | 8202847000 | 15375000000 |
Igniting the spark of knowledge
In the ever-evolving landscape of corporate finance, understanding cost structures is pivotal. This analysis delves into the cost of revenue trends for Eaton Corporation plc and Booz Allen Hamilton Holding Corporation from 2014 to 2023. Over this decade, Eaton Corporation consistently maintained a higher cost of revenue, peaking in 2014 with approximately 15.6 billion USD. However, a notable dip occurred in 2020, reflecting a 20% decrease from its 2014 peak, likely influenced by global economic shifts.
Conversely, Booz Allen Hamilton exhibited a steady upward trajectory, with costs rising by nearly 60% from 2014 to 2023. The year 2024 shows an anomaly with a significant spike, indicating potential data gaps or extraordinary circumstances. This comparative insight underscores the dynamic nature of corporate expenses and the importance of strategic financial management.

Comparing Revenue Performance: Eaton Corporation plc or Booz Allen Hamilton Holding Corporation?
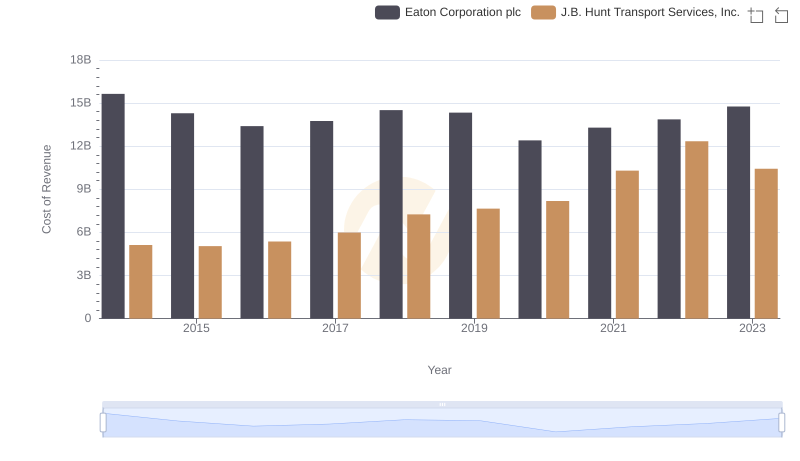
Cost of Revenue: Key Insights for Eaton Corporation plc and J.B. Hunt Transport Services, Inc.
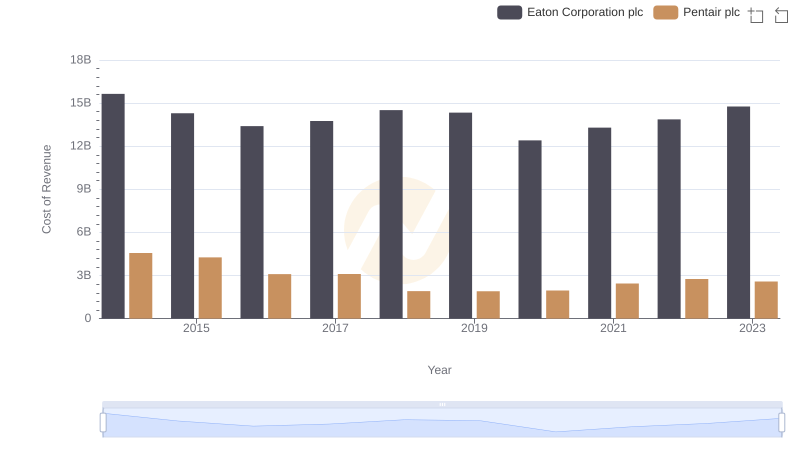
Comparing Cost of Revenue Efficiency: Eaton Corporation plc vs Pentair plc
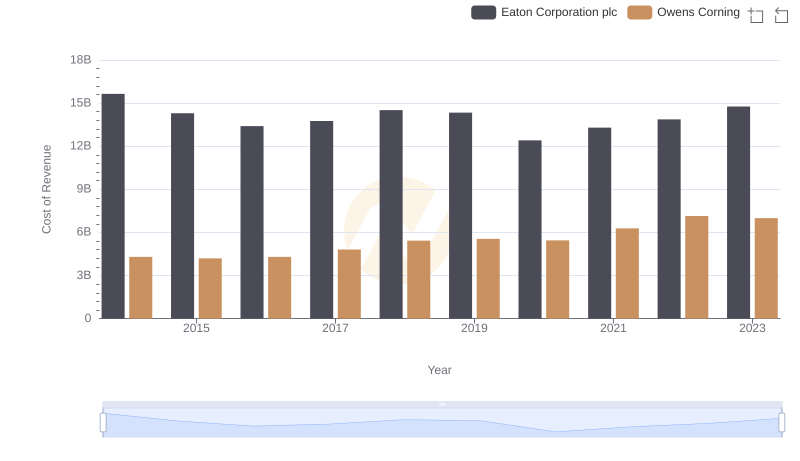
Cost of Revenue Comparison: Eaton Corporation plc vs Owens Corning

Cost Insights: Breaking Down Eaton Corporation plc and RB Global, Inc.'s Expenses
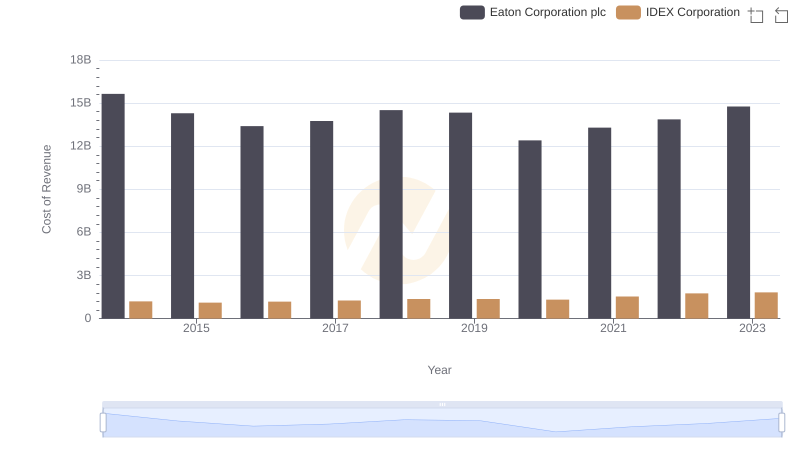
Comparing Cost of Revenue Efficiency: Eaton Corporation plc vs IDEX Corporation
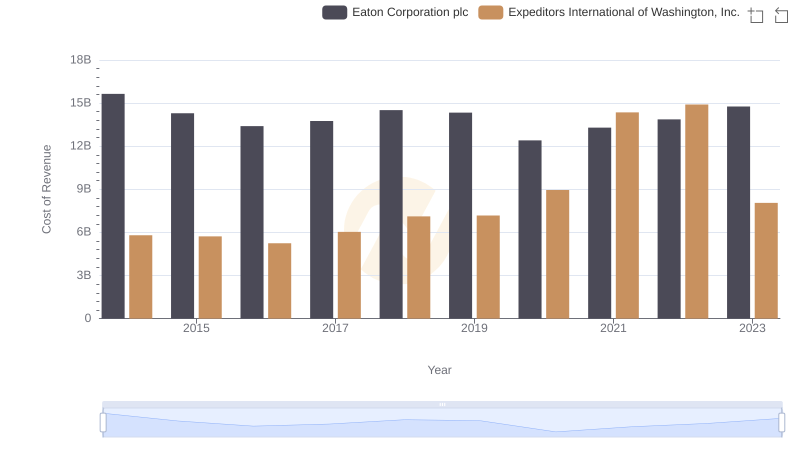
Eaton Corporation plc vs Expeditors International of Washington, Inc.: Efficiency in Cost of Revenue Explored
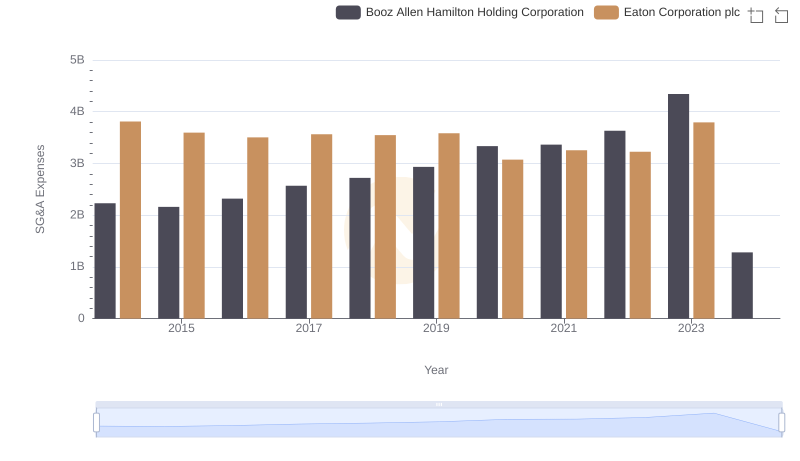
Who Optimizes SG&A Costs Better? Eaton Corporation plc or Booz Allen Hamilton Holding Corporation