| __timestamp | Eaton Corporation plc | Owens Corning |
|---|---|---|
| Wednesday, January 1, 2014 | 15646000000 | 4300000000 |
| Thursday, January 1, 2015 | 14292000000 | 4197000000 |
| Friday, January 1, 2016 | 13400000000 | 4296000000 |
| Sunday, January 1, 2017 | 13756000000 | 4812000000 |
| Monday, January 1, 2018 | 14511000000 | 5425000000 |
| Tuesday, January 1, 2019 | 14338000000 | 5551000000 |
| Wednesday, January 1, 2020 | 12408000000 | 5445000000 |
| Friday, January 1, 2021 | 13293000000 | 6281000000 |
| Saturday, January 1, 2022 | 13865000000 | 7145000000 |
| Sunday, January 1, 2023 | 14763000000 | 6994000000 |
| Monday, January 1, 2024 | 15375000000 |
Cracking the code
In the ever-evolving landscape of industrial manufacturing, understanding cost structures is pivotal. Over the past decade, Eaton Corporation plc and Owens Corning have showcased distinct trajectories in their cost of revenue. Eaton, a leader in power management, has seen its cost of revenue fluctuate, peaking in 2014 and 2023 with a notable dip in 2020, reflecting a 21% decrease from its 2014 high. This could be attributed to strategic cost management or market conditions. Meanwhile, Owens Corning, a stalwart in building materials, has experienced a steady climb, with a 66% increase from 2014 to 2022, indicating robust growth and possibly expanded operations. The contrasting trends highlight Eaton's resilience in maintaining cost efficiency, while Owens Corning's upward trajectory underscores its expansion strategy. As we delve into these insights, the data offers a compelling narrative of strategic financial management in the industrial sector.
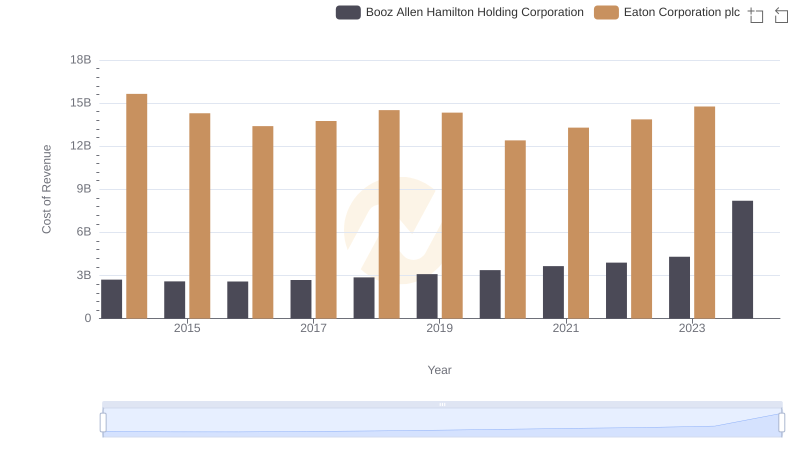
Cost Insights: Breaking Down Eaton Corporation plc and Booz Allen Hamilton Holding Corporation's Expenses
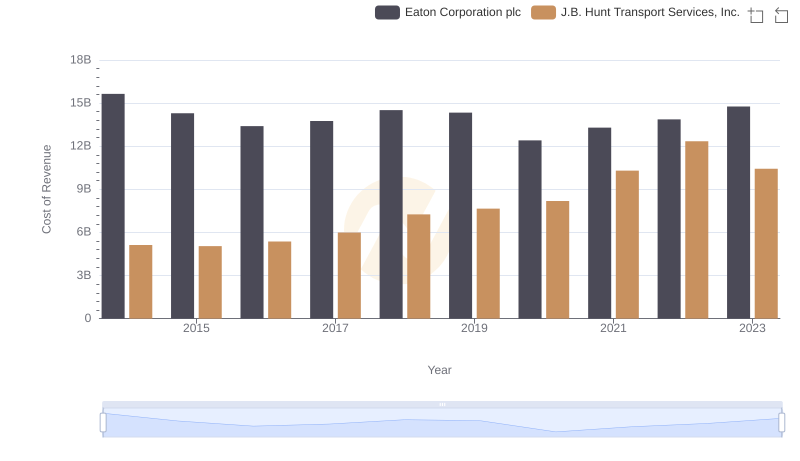
Cost of Revenue: Key Insights for Eaton Corporation plc and J.B. Hunt Transport Services, Inc.
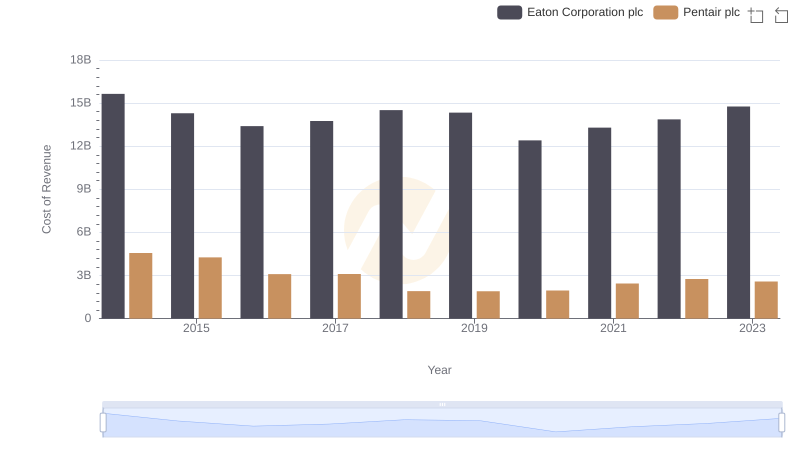
Comparing Cost of Revenue Efficiency: Eaton Corporation plc vs Pentair plc

Cost Insights: Breaking Down Eaton Corporation plc and RB Global, Inc.'s Expenses
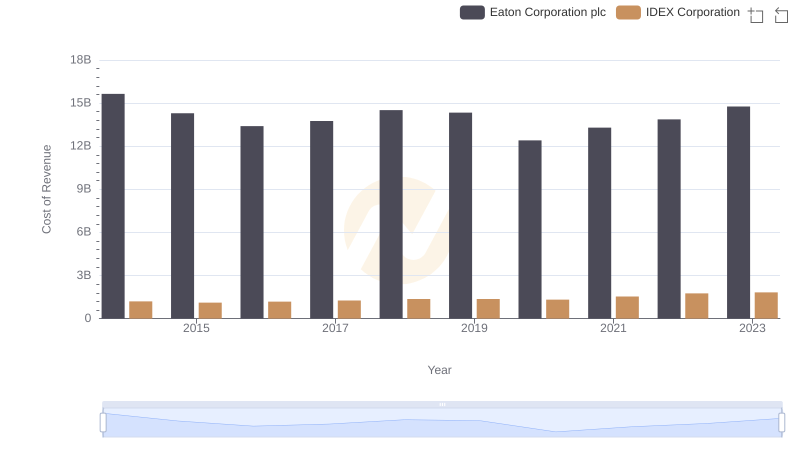
Comparing Cost of Revenue Efficiency: Eaton Corporation plc vs IDEX Corporation
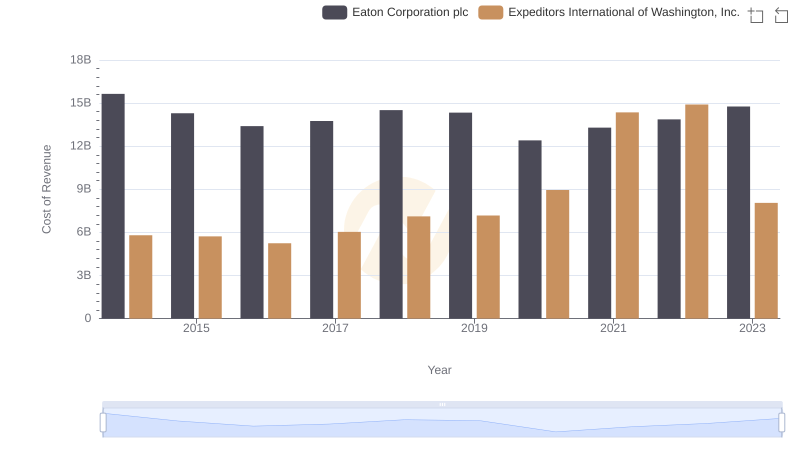
Eaton Corporation plc vs Expeditors International of Washington, Inc.: Efficiency in Cost of Revenue Explored
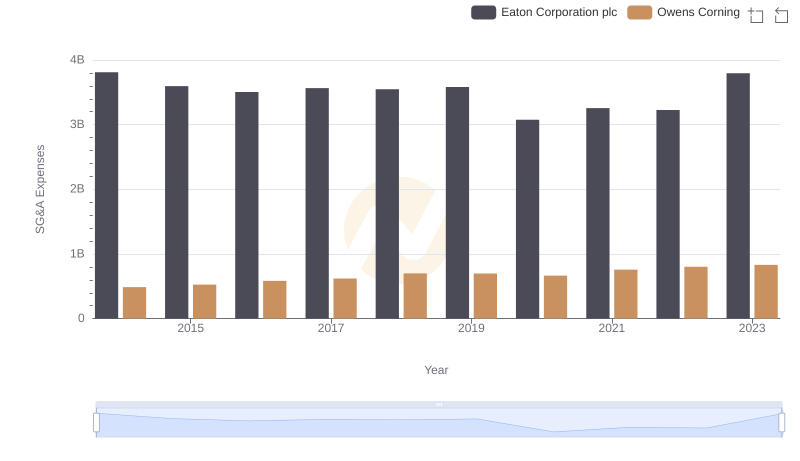
Eaton Corporation plc and Owens Corning: SG&A Spending Patterns Compared