| __timestamp | Eaton Corporation plc | J.B. Hunt Transport Services, Inc. |
|---|---|---|
| Wednesday, January 1, 2014 | 15646000000 | 5124095000 |
| Thursday, January 1, 2015 | 14292000000 | 5041472000 |
| Friday, January 1, 2016 | 13400000000 | 5369826000 |
| Sunday, January 1, 2017 | 13756000000 | 5990275000 |
| Monday, January 1, 2018 | 14511000000 | 7255657000 |
| Tuesday, January 1, 2019 | 14338000000 | 7659003000 |
| Wednesday, January 1, 2020 | 12408000000 | 8186697000 |
| Friday, January 1, 2021 | 13293000000 | 10298483000 |
| Saturday, January 1, 2022 | 13865000000 | 12341472000 |
| Sunday, January 1, 2023 | 14763000000 | 10433277000 |
| Monday, January 1, 2024 | 15375000000 |
Igniting the spark of knowledge
In the ever-evolving landscape of industrial and transportation sectors, understanding cost dynamics is crucial. From 2014 to 2023, Eaton Corporation plc and J.B. Hunt Transport Services, Inc. have showcased distinct trajectories in their cost of revenue. Eaton's cost of revenue peaked in 2014, with a gradual decline of approximately 6% by 2020, reflecting strategic cost management. However, a resurgence is evident, with a 19% increase by 2023, indicating potential growth or increased operational costs. Conversely, J.B. Hunt's cost of revenue has surged by over 100% from 2014 to 2022, highlighting its expansion and increased operational scale. The year 2020 marked a pivotal point for both companies, with Eaton experiencing its lowest cost, while J.B. Hunt continued its upward trend. These insights provide a window into the strategic maneuvers and market conditions influencing these industry giants.
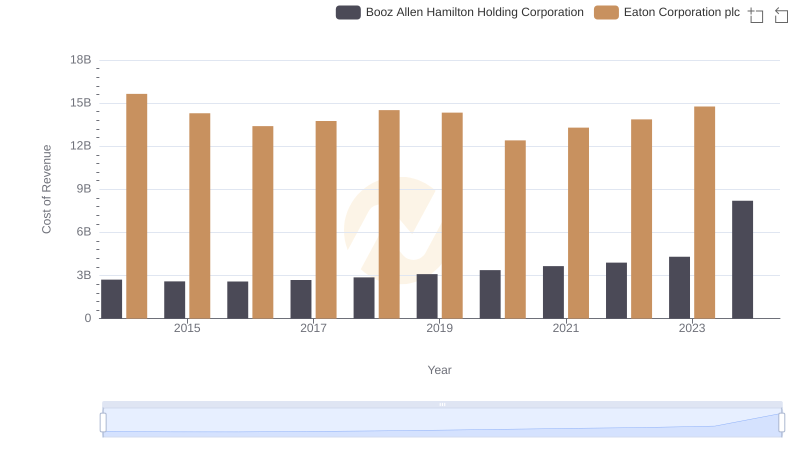
Cost Insights: Breaking Down Eaton Corporation plc and Booz Allen Hamilton Holding Corporation's Expenses
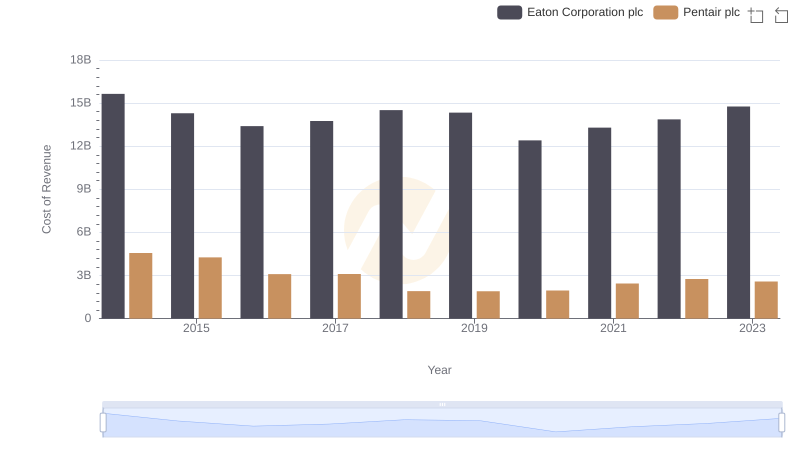
Comparing Cost of Revenue Efficiency: Eaton Corporation plc vs Pentair plc
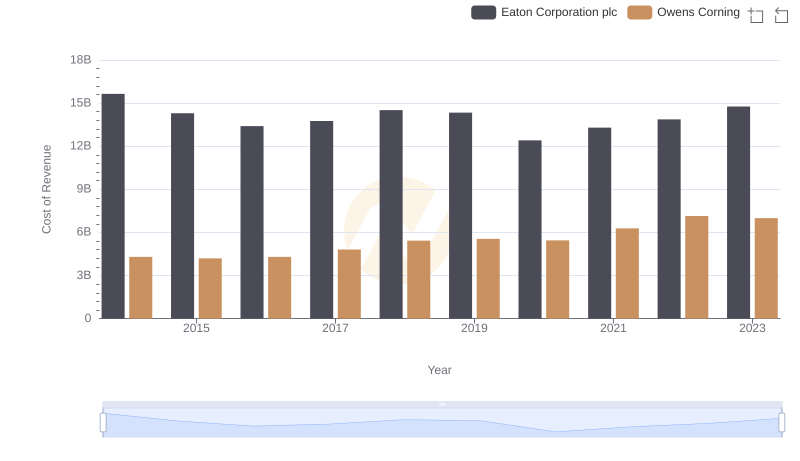
Cost of Revenue Comparison: Eaton Corporation plc vs Owens Corning
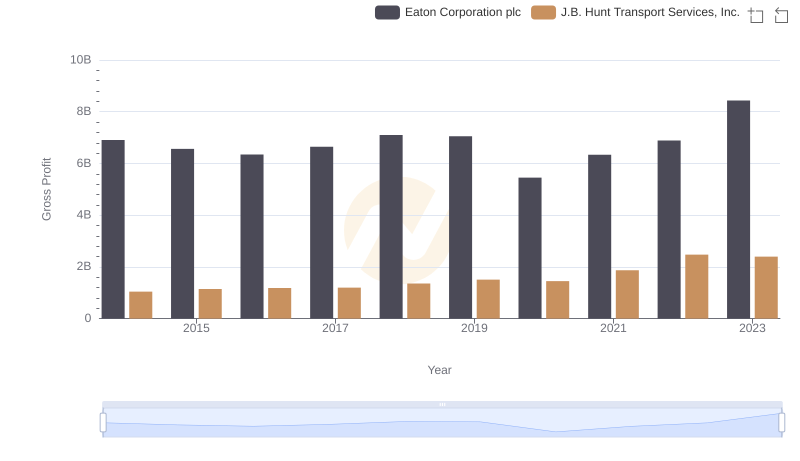
Gross Profit Comparison: Eaton Corporation plc and J.B. Hunt Transport Services, Inc. Trends

Cost Insights: Breaking Down Eaton Corporation plc and RB Global, Inc.'s Expenses
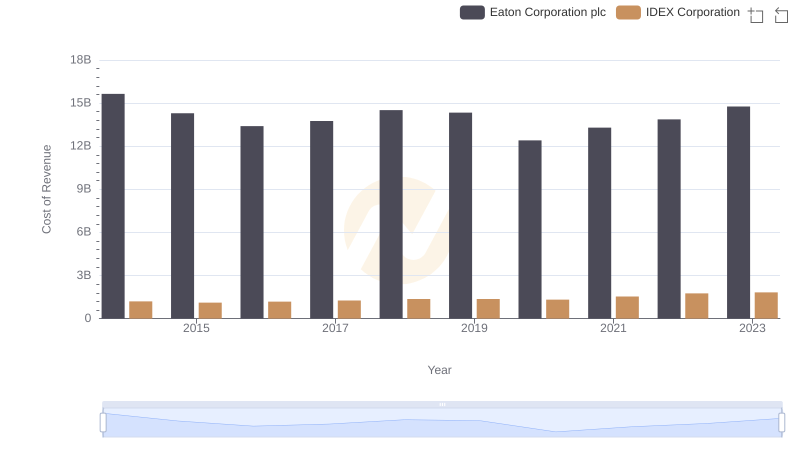
Comparing Cost of Revenue Efficiency: Eaton Corporation plc vs IDEX Corporation
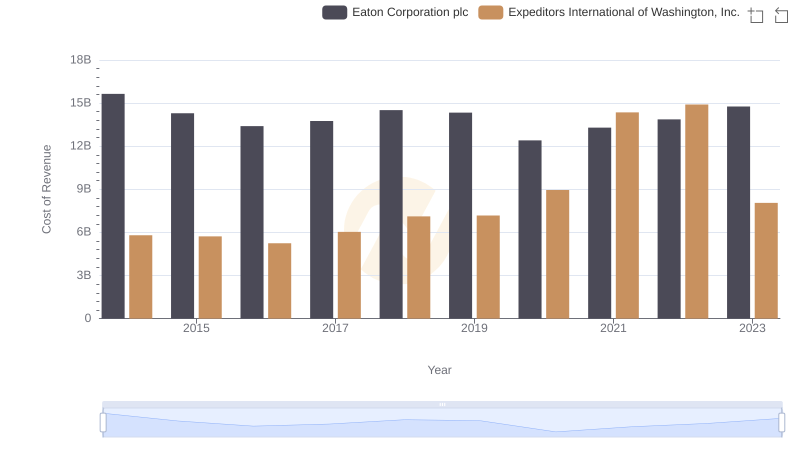
Eaton Corporation plc vs Expeditors International of Washington, Inc.: Efficiency in Cost of Revenue Explored