| __timestamp | Booz Allen Hamilton Holding Corporation | Eaton Corporation plc |
|---|---|---|
| Wednesday, January 1, 2014 | 5478693000 | 22552000000 |
| Thursday, January 1, 2015 | 5274770000 | 20855000000 |
| Friday, January 1, 2016 | 5405738000 | 19747000000 |
| Sunday, January 1, 2017 | 5804284000 | 20404000000 |
| Monday, January 1, 2018 | 6171853000 | 21609000000 |
| Tuesday, January 1, 2019 | 6704037000 | 21390000000 |
| Wednesday, January 1, 2020 | 7463841000 | 17858000000 |
| Friday, January 1, 2021 | 7858938000 | 19628000000 |
| Saturday, January 1, 2022 | 8363700000 | 20752000000 |
| Sunday, January 1, 2023 | 9258911000 | 23196000000 |
| Monday, January 1, 2024 | 10661896000 | 24878000000 |
Igniting the spark of knowledge
In the competitive landscape of corporate America, Eaton Corporation plc and Booz Allen Hamilton Holding Corporation have showcased distinct revenue trajectories over the past decade. From 2014 to 2023, Eaton Corporation consistently outperformed Booz Allen Hamilton in terms of revenue, with Eaton's figures peaking at approximately $23.2 billion in 2023, marking a steady growth of around 3% annually. In contrast, Booz Allen Hamilton's revenue surged by nearly 95% over the same period, reaching an impressive $10.7 billion in 2024.
While Eaton's revenue experienced a slight dip in 2020, likely due to global economic challenges, it rebounded strongly in subsequent years. Booz Allen Hamilton, on the other hand, demonstrated a robust upward trend, particularly from 2020 onwards, reflecting its strategic adaptations and market resilience. This comparison highlights the dynamic nature of revenue growth strategies in diverse sectors.
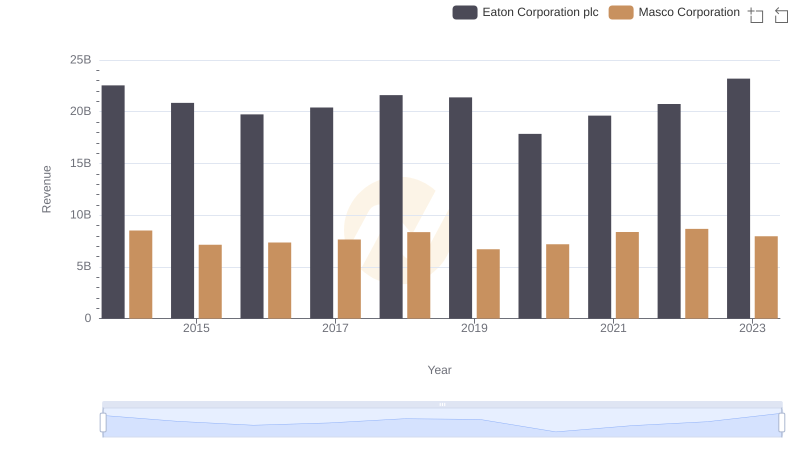
Eaton Corporation plc vs Masco Corporation: Examining Key Revenue Metrics
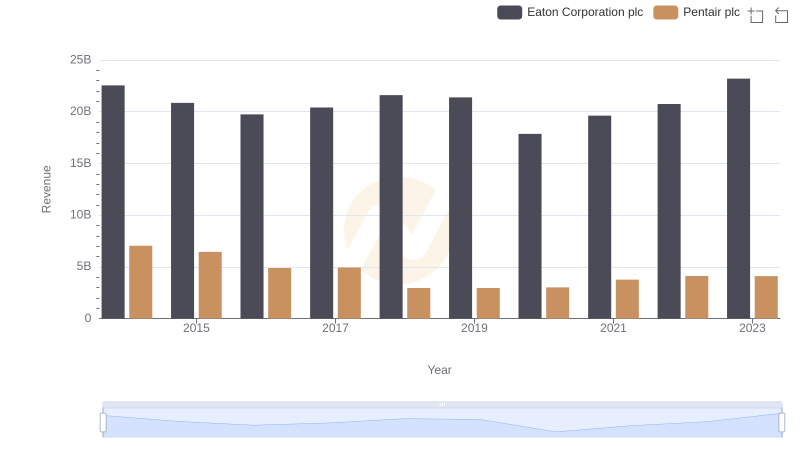
Comparing Revenue Performance: Eaton Corporation plc or Pentair plc?
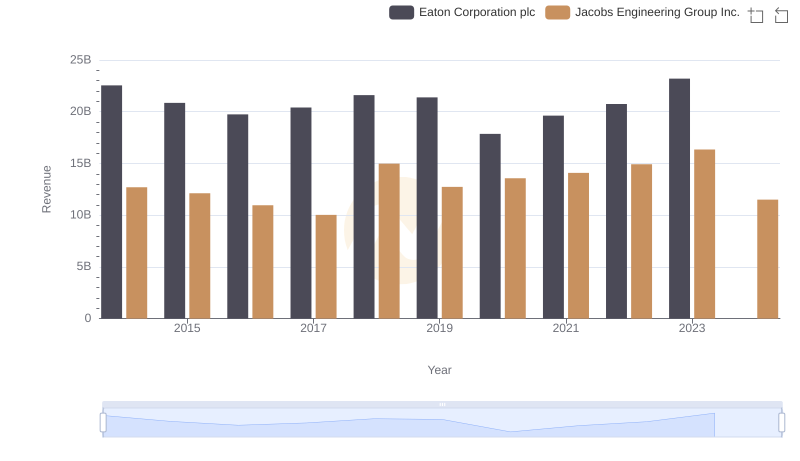
Breaking Down Revenue Trends: Eaton Corporation plc vs Jacobs Engineering Group Inc.

Revenue Insights: Eaton Corporation plc and IDEX Corporation Performance Compared
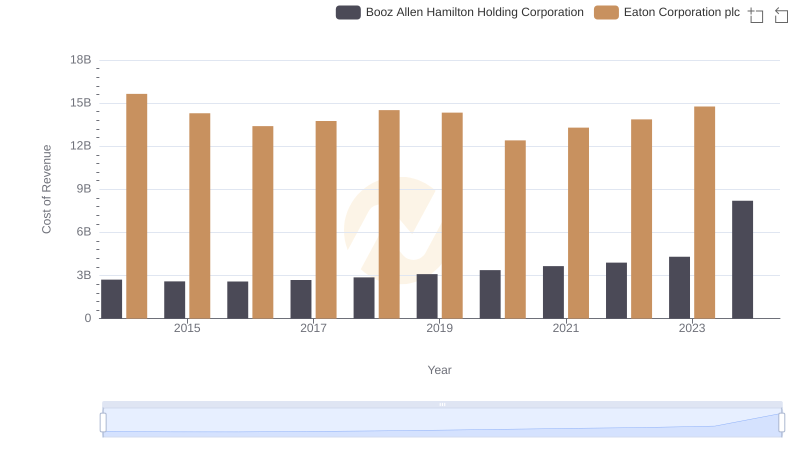
Cost Insights: Breaking Down Eaton Corporation plc and Booz Allen Hamilton Holding Corporation's Expenses
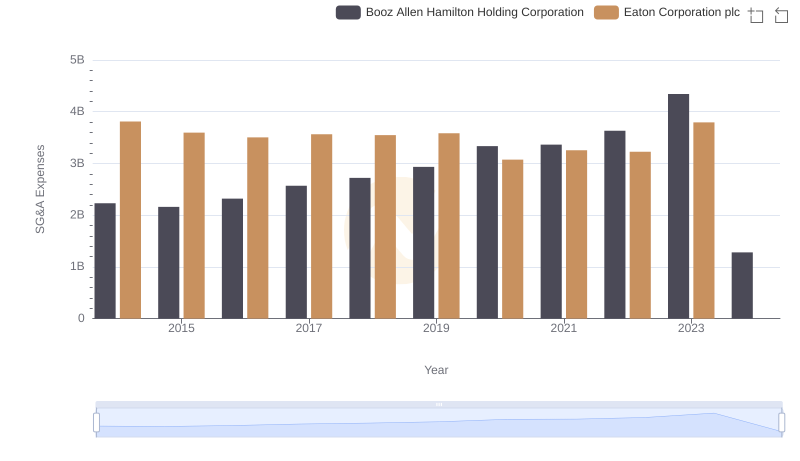
Who Optimizes SG&A Costs Better? Eaton Corporation plc or Booz Allen Hamilton Holding Corporation