| __timestamp | Automatic Data Processing, Inc. | CSX Corporation |
|---|---|---|
| Wednesday, January 1, 2014 | 7221400000 | 9056000000 |
| Thursday, January 1, 2015 | 6427600000 | 8227000000 |
| Friday, January 1, 2016 | 6840300000 | 7680000000 |
| Sunday, January 1, 2017 | 7269800000 | 7635000000 |
| Monday, January 1, 2018 | 7842600000 | 7477000000 |
| Tuesday, January 1, 2019 | 8086600000 | 7063000000 |
| Wednesday, January 1, 2020 | 8445100000 | 6221000000 |
| Friday, January 1, 2021 | 8640300000 | 7382000000 |
| Saturday, January 1, 2022 | 9461900000 | 9068000000 |
| Sunday, January 1, 2023 | 9953400000 | 9130000000 |
| Monday, January 1, 2024 | 10476700000 |
Data in motion
In the ever-evolving landscape of corporate finance, understanding cost structures is pivotal. Automatic Data Processing, Inc. (ADP) and CSX Corporation, two giants in their respective industries, offer a fascinating study in cost management over the past decade. From 2014 to 2023, ADP's cost of revenue has seen a steady climb, peaking at approximately $10.5 billion in 2023, marking a 45% increase from 2014. In contrast, CSX Corporation's expenses have fluctuated, with a notable dip in 2020, likely due to global economic disruptions, before rebounding to $9.13 billion in 2023. This comparative analysis highlights ADP's consistent growth trajectory, while CSX's costs reflect a more volatile pattern. Missing data for 2024 suggests a need for further analysis to understand future trends. Such insights are crucial for investors and stakeholders aiming to navigate the complexities of corporate expenses.
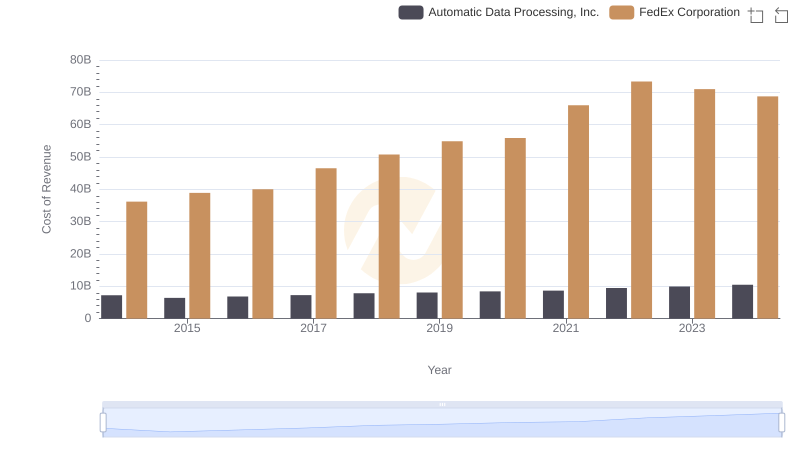
Cost Insights: Breaking Down Automatic Data Processing, Inc. and FedEx Corporation's Expenses
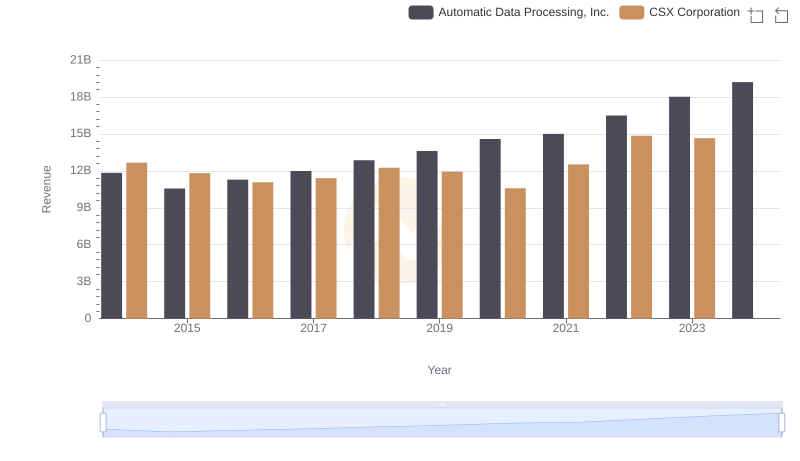
Breaking Down Revenue Trends: Automatic Data Processing, Inc. vs CSX Corporation
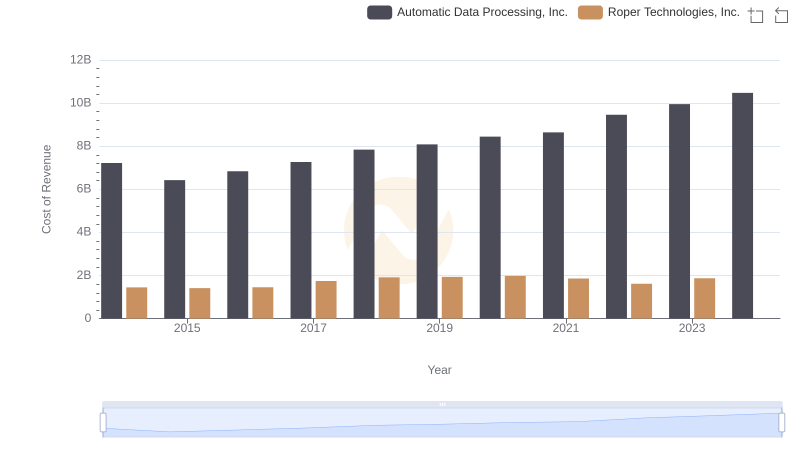
Cost Insights: Breaking Down Automatic Data Processing, Inc. and Roper Technologies, Inc.'s Expenses
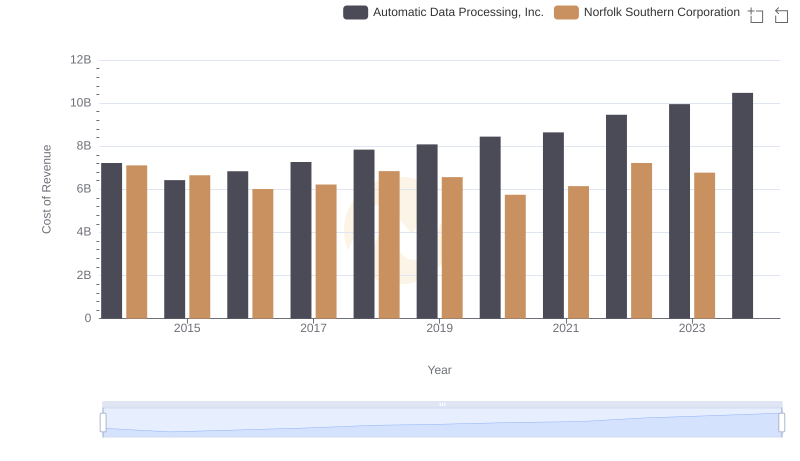
Cost of Revenue Trends: Automatic Data Processing, Inc. vs Norfolk Southern Corporation
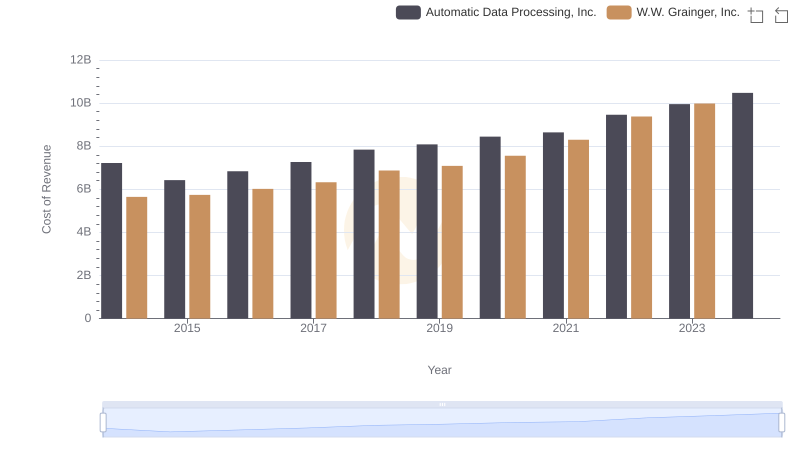
Automatic Data Processing, Inc. vs W.W. Grainger, Inc.: Efficiency in Cost of Revenue Explored
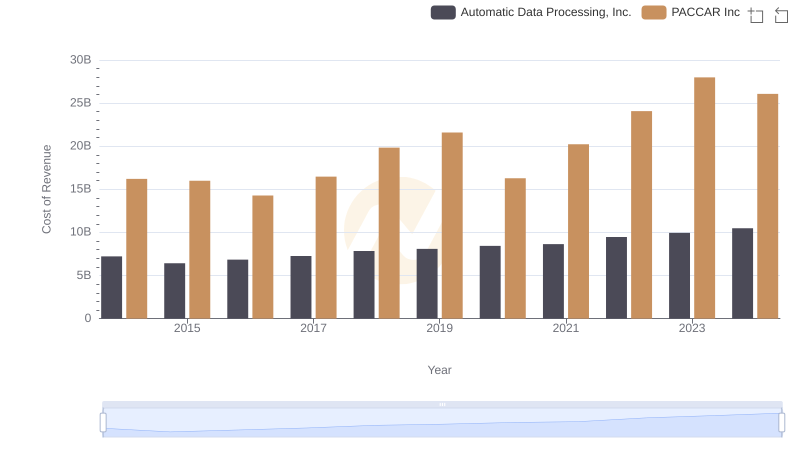
Automatic Data Processing, Inc. vs PACCAR Inc: Efficiency in Cost of Revenue Explored
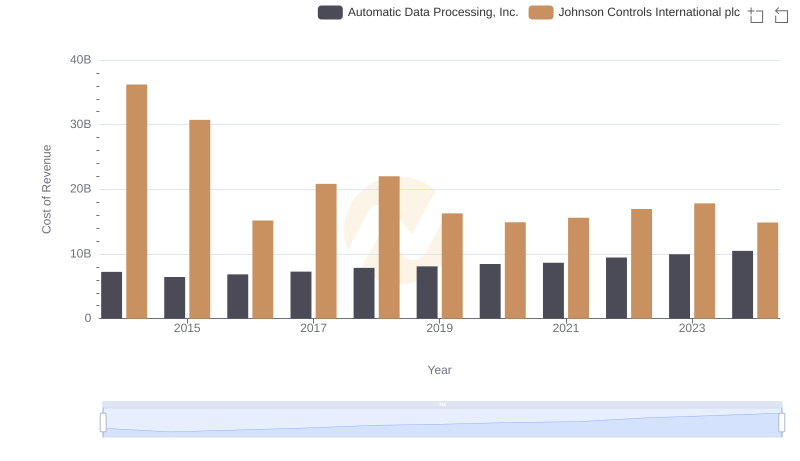
Cost Insights: Breaking Down Automatic Data Processing, Inc. and Johnson Controls International plc's Expenses
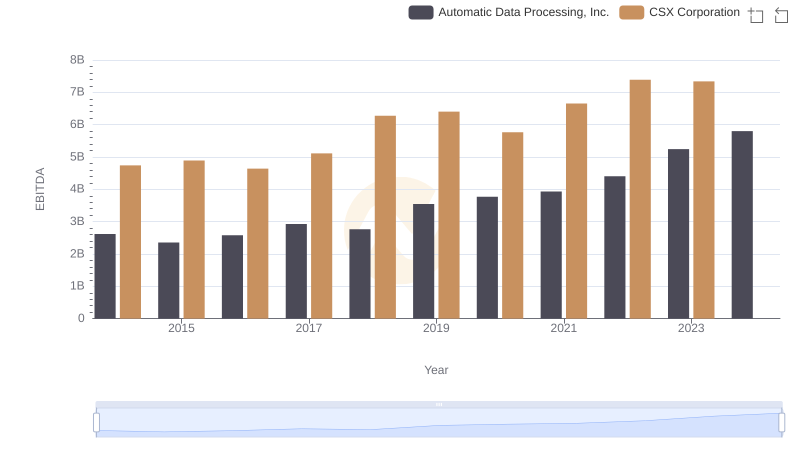
A Side-by-Side Analysis of EBITDA: Automatic Data Processing, Inc. and CSX Corporation