| __timestamp | Automatic Data Processing, Inc. | Norfolk Southern Corporation |
|---|---|---|
| Wednesday, January 1, 2014 | 7221400000 | 7109000000 |
| Thursday, January 1, 2015 | 6427600000 | 6651000000 |
| Friday, January 1, 2016 | 6840300000 | 6015000000 |
| Sunday, January 1, 2017 | 7269800000 | 6224000000 |
| Monday, January 1, 2018 | 7842600000 | 6844000000 |
| Tuesday, January 1, 2019 | 8086600000 | 6567000000 |
| Wednesday, January 1, 2020 | 8445100000 | 5749000000 |
| Friday, January 1, 2021 | 8640300000 | 6148000000 |
| Saturday, January 1, 2022 | 9461900000 | 7223000000 |
| Sunday, January 1, 2023 | 9953400000 | 6774000000 |
| Monday, January 1, 2024 | 10476700000 | 7580000000 |
Infusing magic into the data realm
In the ever-evolving landscape of American business, understanding cost structures is crucial. Automatic Data Processing, Inc. (ADP) and Norfolk Southern Corporation (NSC) offer a fascinating glimpse into cost of revenue trends over the past decade. From 2014 to 2023, ADP's cost of revenue has surged by approximately 45%, reflecting its expanding operations and market reach. In contrast, NSC's cost of revenue has shown a more modest increase of around 5%, indicative of its stable yet steady growth in the transportation sector. Notably, ADP's cost of revenue consistently outpaced NSC's, highlighting the differing scales and operational strategies of these industry giants. The data for 2024 is incomplete, suggesting a need for further analysis as new information becomes available. This comparison underscores the dynamic nature of cost management in diverse sectors, offering valuable insights for investors and analysts alike.

Cost Insights: Breaking Down Automatic Data Processing, Inc. and CSX Corporation's Expenses
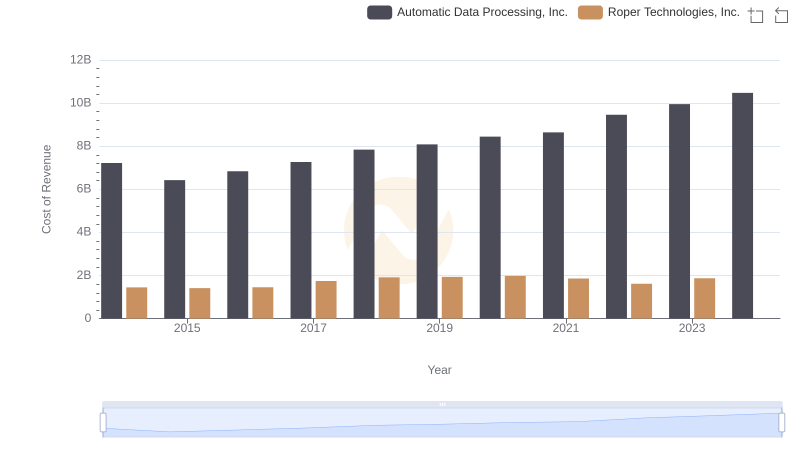
Cost Insights: Breaking Down Automatic Data Processing, Inc. and Roper Technologies, Inc.'s Expenses
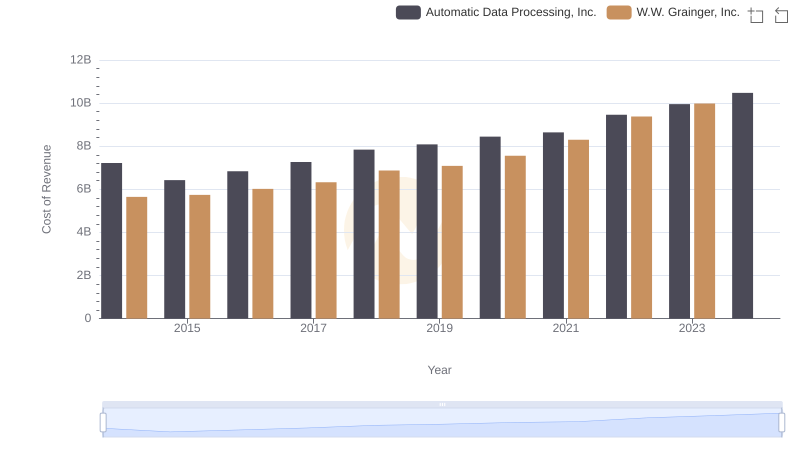
Automatic Data Processing, Inc. vs W.W. Grainger, Inc.: Efficiency in Cost of Revenue Explored
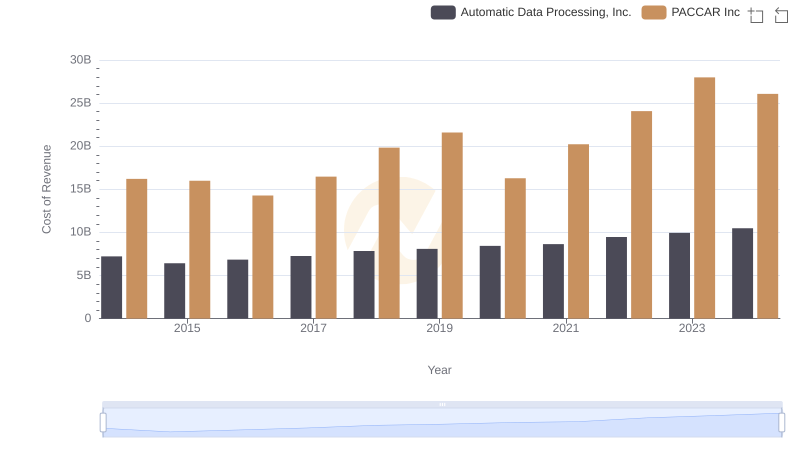
Automatic Data Processing, Inc. vs PACCAR Inc: Efficiency in Cost of Revenue Explored
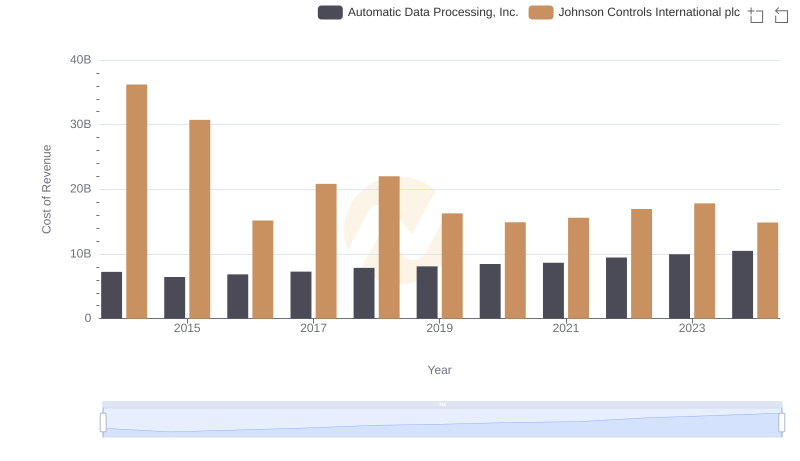
Cost Insights: Breaking Down Automatic Data Processing, Inc. and Johnson Controls International plc's Expenses
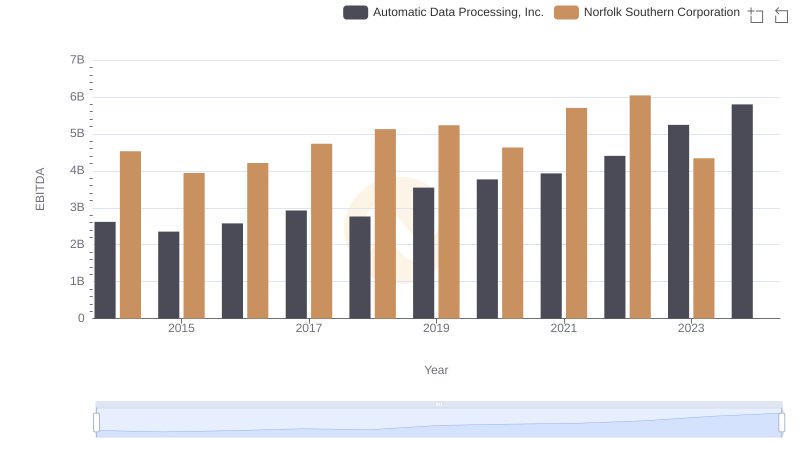
Comparative EBITDA Analysis: Automatic Data Processing, Inc. vs Norfolk Southern Corporation
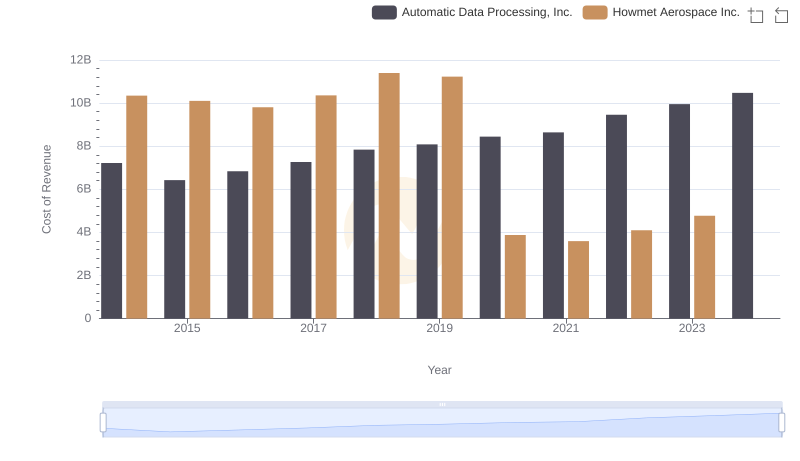
Analyzing Cost of Revenue: Automatic Data Processing, Inc. and Howmet Aerospace Inc.