| __timestamp | Automatic Data Processing, Inc. | PACCAR Inc |
|---|---|---|
| Wednesday, January 1, 2014 | 7221400000 | 16203800000 |
| Thursday, January 1, 2015 | 6427600000 | 15993800000 |
| Friday, January 1, 2016 | 6840300000 | 14280100000 |
| Sunday, January 1, 2017 | 7269800000 | 16470800000 |
| Monday, January 1, 2018 | 7842600000 | 19839900000 |
| Tuesday, January 1, 2019 | 8086600000 | 21584300000 |
| Wednesday, January 1, 2020 | 8445100000 | 16276500000 |
| Friday, January 1, 2021 | 8640300000 | 20230400000 |
| Saturday, January 1, 2022 | 9461900000 | 24068100000 |
| Sunday, January 1, 2023 | 9953400000 | 27985500000 |
| Monday, January 1, 2024 | 10476700000 | 26069600000 |
Unleashing insights
In the ever-evolving landscape of corporate efficiency, understanding cost dynamics is crucial. This analysis delves into the cost of revenue trends for Automatic Data Processing, Inc. (ADP) and PACCAR Inc over the past decade. From 2014 to 2024, ADP's cost of revenue has seen a steady increase, rising approximately 45% from $7.2 billion to $10.5 billion. In contrast, PACCAR's cost of revenue surged by about 61%, from $16.2 billion to $26.1 billion.
This data highlights a significant divergence in cost management strategies between the two companies. While both have experienced growth, PACCAR's larger increase suggests a more aggressive expansion or higher operational costs. Understanding these trends provides valuable insights into each company's operational efficiency and strategic priorities. As businesses navigate the complexities of the modern economy, such analyses become indispensable for investors and stakeholders alike.
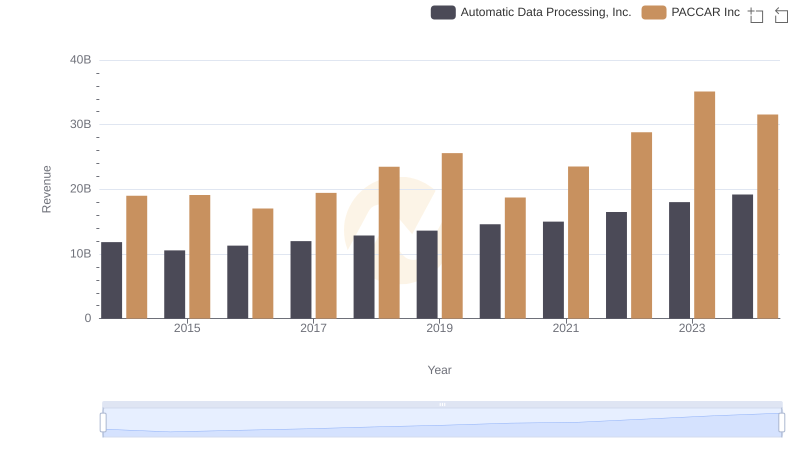
Automatic Data Processing, Inc. or PACCAR Inc: Who Leads in Yearly Revenue?

Cost Insights: Breaking Down Automatic Data Processing, Inc. and CSX Corporation's Expenses
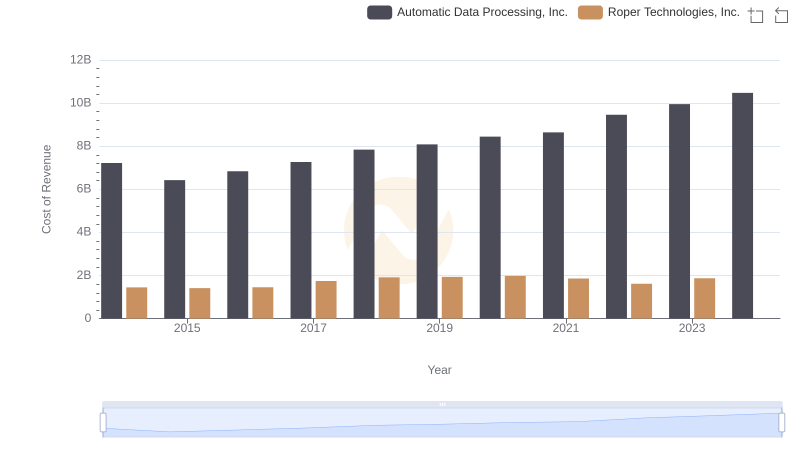
Cost Insights: Breaking Down Automatic Data Processing, Inc. and Roper Technologies, Inc.'s Expenses
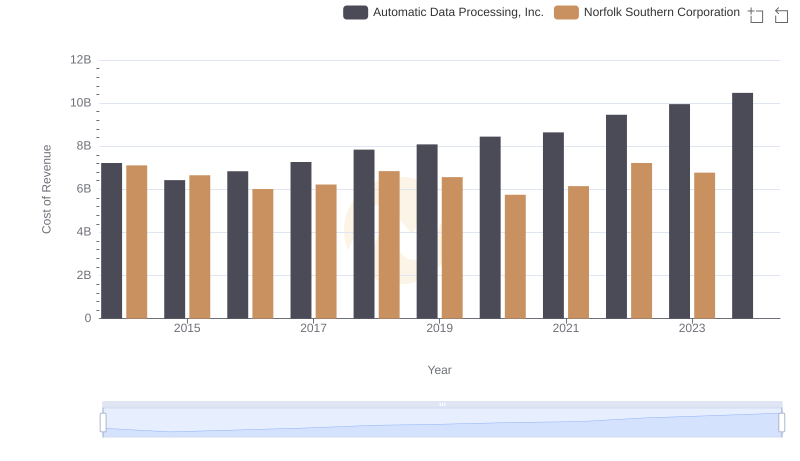
Cost of Revenue Trends: Automatic Data Processing, Inc. vs Norfolk Southern Corporation
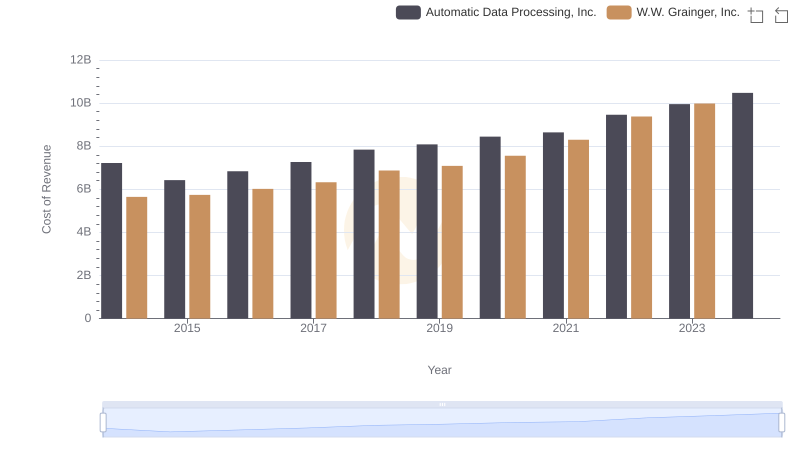
Automatic Data Processing, Inc. vs W.W. Grainger, Inc.: Efficiency in Cost of Revenue Explored
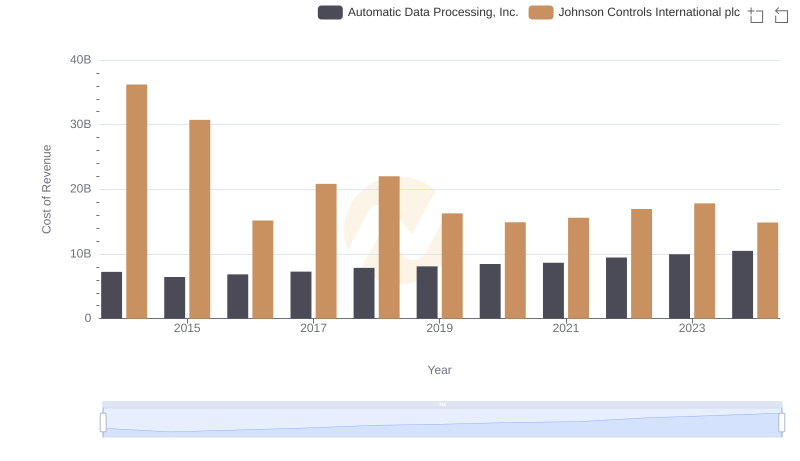
Cost Insights: Breaking Down Automatic Data Processing, Inc. and Johnson Controls International plc's Expenses
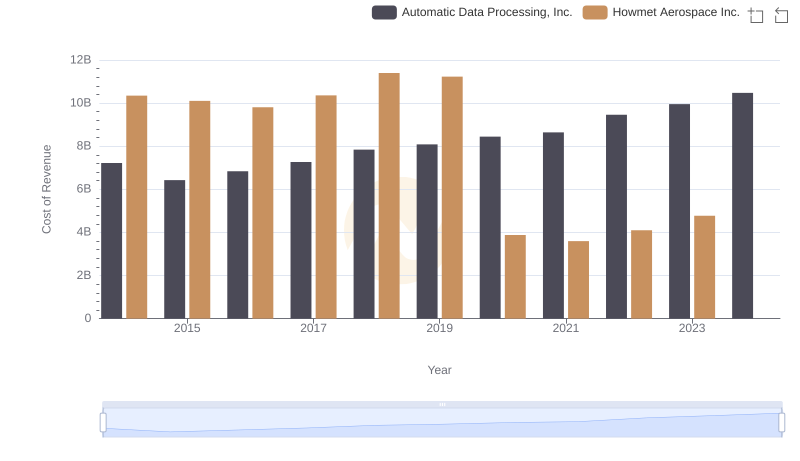
Analyzing Cost of Revenue: Automatic Data Processing, Inc. and Howmet Aerospace Inc.