| __timestamp | HP Inc. | Microchip Technology Incorporated |
|---|---|---|
| Wednesday, January 1, 2014 | 13353000000 | 267278000 |
| Thursday, January 1, 2015 | 4720000000 | 274815000 |
| Friday, January 1, 2016 | 3840000000 | 301670000 |
| Sunday, January 1, 2017 | 4376000000 | 499811000 |
| Monday, January 1, 2018 | 4866000000 | 452100000 |
| Tuesday, January 1, 2019 | 5368000000 | 682900000 |
| Wednesday, January 1, 2020 | 4906000000 | 676600000 |
| Friday, January 1, 2021 | 5741000000 | 610300000 |
| Saturday, January 1, 2022 | 5264000000 | 718900000 |
| Sunday, January 1, 2023 | 5356000000 | 797700000 |
| Monday, January 1, 2024 | 5658000000 | 734200000 |
Unleashing insights
In the ever-evolving landscape of technology, understanding the financial strategies of industry leaders is crucial. This analysis delves into the Selling, General, and Administrative (SG&A) expenses of HP Inc. and Microchip Technology Incorporated from 2014 to 2024.
HP Inc. has experienced significant fluctuations in its SG&A expenses over the past decade. Starting at a peak in 2014, the company saw a dramatic 64% drop by 2015. However, HP's expenses have stabilized in recent years, averaging around $5.5 billion annually.
In contrast, Microchip Technology has shown a consistent upward trend in SG&A expenses, growing by nearly 200% from 2014 to 2024. This steady increase reflects the company's strategic investments in growth and expansion.
These trends highlight the contrasting financial strategies of these tech giants, offering valuable insights for investors and industry analysts alike.
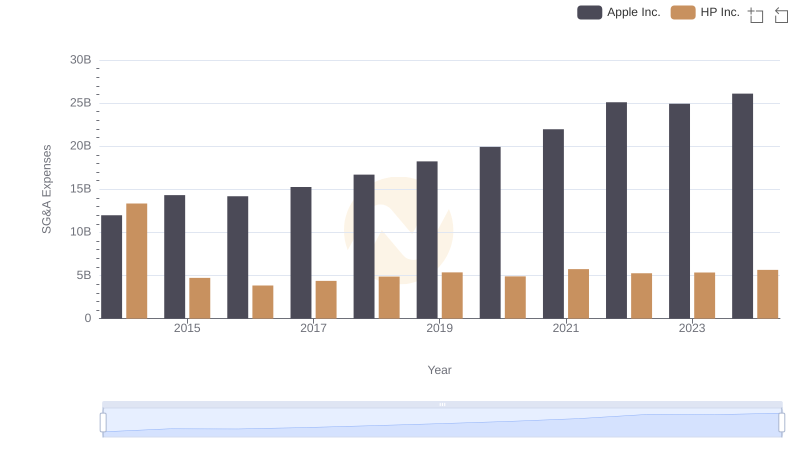
Apple Inc. and HP Inc.: SG&A Spending Patterns Compared
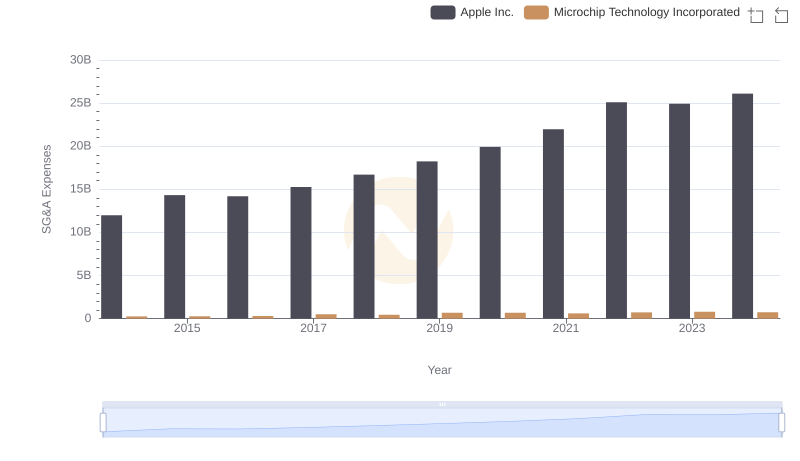
Apple Inc. vs Microchip Technology Incorporated: SG&A Expense Trends
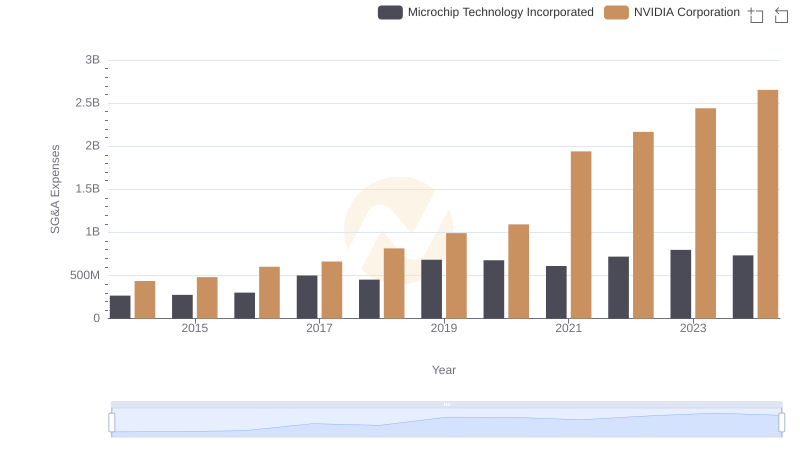
Selling, General, and Administrative Costs: NVIDIA Corporation vs Microchip Technology Incorporated
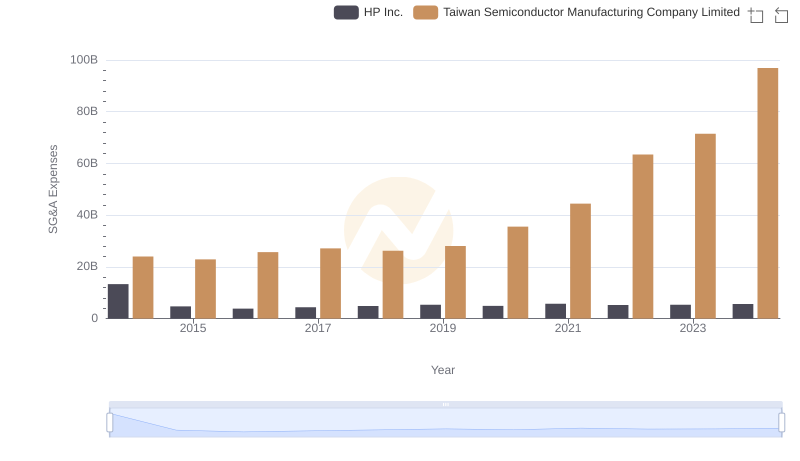
Selling, General, and Administrative Costs: Taiwan Semiconductor Manufacturing Company Limited vs HP Inc.
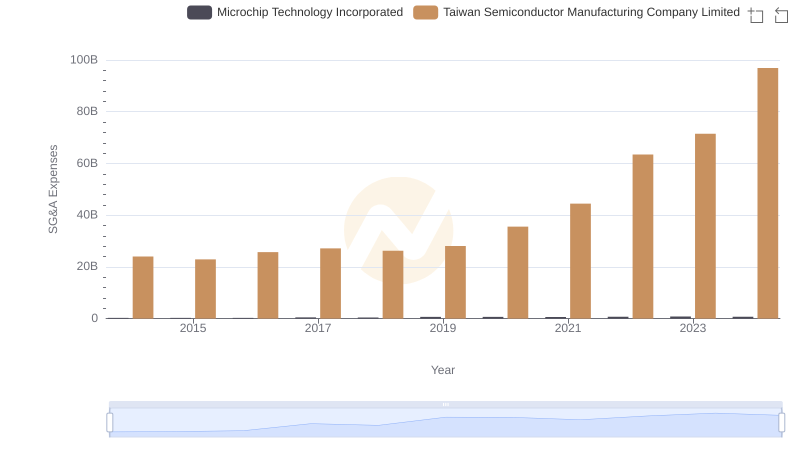
Taiwan Semiconductor Manufacturing Company Limited or Microchip Technology Incorporated: Who Manages SG&A Costs Better?
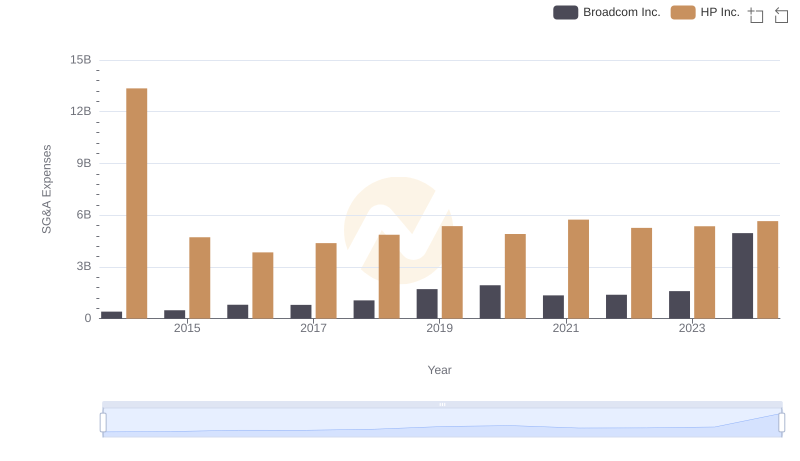
Comparing SG&A Expenses: Broadcom Inc. vs HP Inc. Trends and Insights
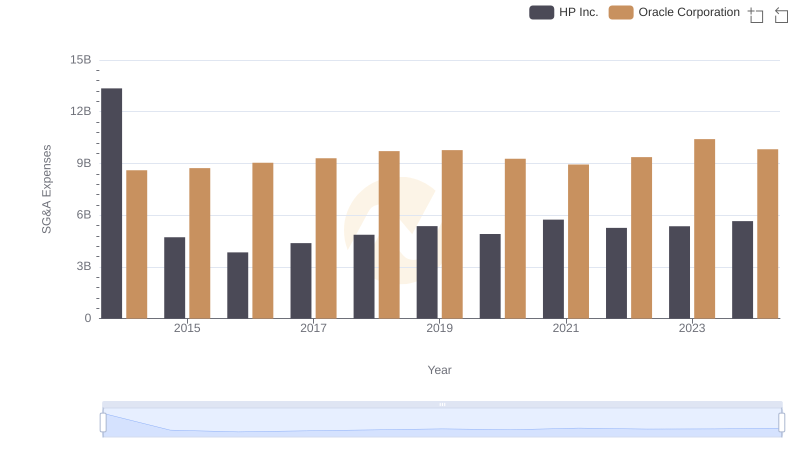
Oracle Corporation or HP Inc.: Who Manages SG&A Costs Better?
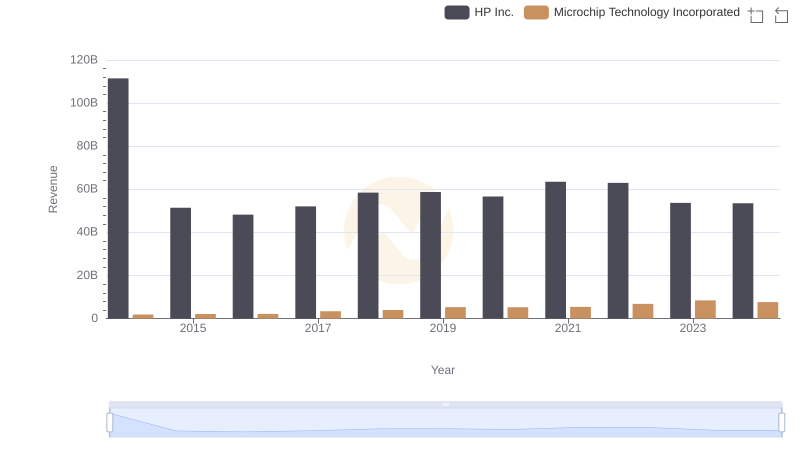
Breaking Down Revenue Trends: HP Inc. vs Microchip Technology Incorporated
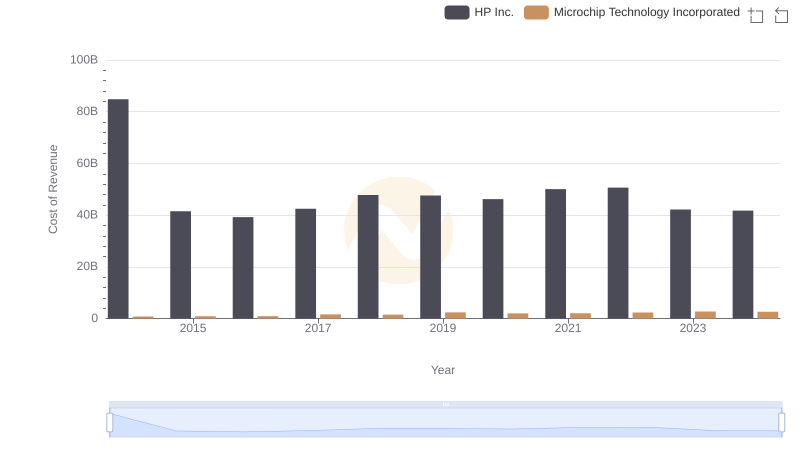
Cost of Revenue Comparison: HP Inc. vs Microchip Technology Incorporated
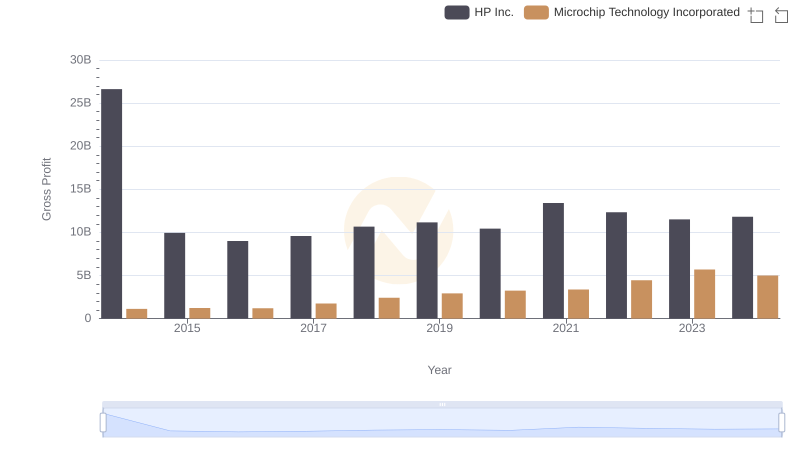
HP Inc. and Microchip Technology Incorporated: A Detailed Gross Profit Analysis
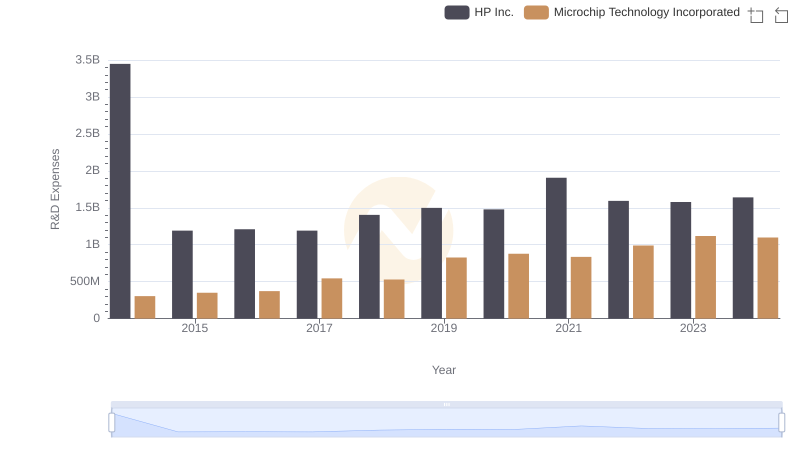
Comparing Innovation Spending: HP Inc. and Microchip Technology Incorporated
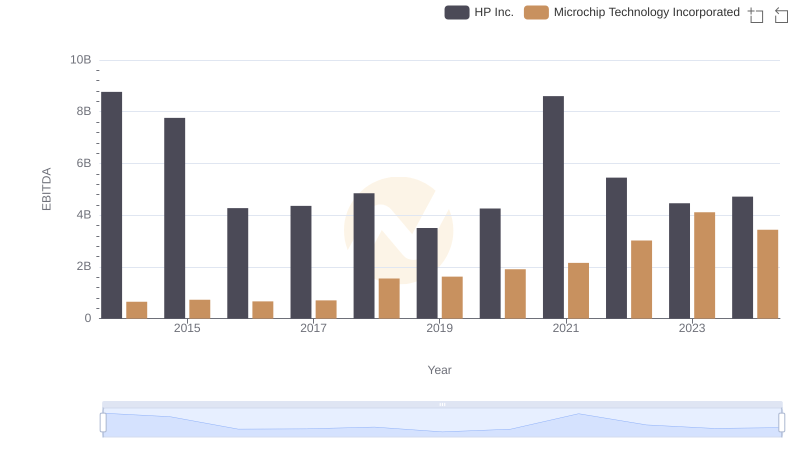
EBITDA Performance Review: HP Inc. vs Microchip Technology Incorporated