| __timestamp | HP Inc. | Microchip Technology Incorporated |
|---|---|---|
| Wednesday, January 1, 2014 | 8766000000 | 651027000 |
| Thursday, January 1, 2015 | 7760000000 | 731158000 |
| Friday, January 1, 2016 | 4272000000 | 668482000 |
| Sunday, January 1, 2017 | 4359000000 | 705341000 |
| Monday, January 1, 2018 | 4847000000 | 1552200000 |
| Tuesday, January 1, 2019 | 3504000000 | 1624400000 |
| Wednesday, January 1, 2020 | 4256000000 | 1909400000 |
| Friday, January 1, 2021 | 8603000000 | 2153100000 |
| Saturday, January 1, 2022 | 5453000000 | 3022600000 |
| Sunday, January 1, 2023 | 4462000000 | 4112000000 |
| Monday, January 1, 2024 | 4716000000 | 3438200000 |
Unlocking the unknown
In the ever-evolving landscape of technology, financial performance is a key indicator of a company's resilience and adaptability. Over the past decade, HP Inc. and Microchip Technology Incorporated have showcased contrasting EBITDA trajectories.
HP Inc. started strong in 2014, with EBITDA peaking at approximately $8.8 billion. However, the subsequent years saw fluctuations, with a notable dip in 2019 to around $3.5 billion. Despite a resurgence in 2021, HP's EBITDA in 2023 settled at about $4.5 billion, reflecting a 49% decrease from its 2014 high.
Conversely, Microchip Technology has demonstrated a steady upward trend. From a modest $651 million in 2014, its EBITDA surged to over $4.1 billion by 2023, marking a remarkable 531% increase. This growth underscores Microchip's strategic positioning in the semiconductor industry.
In summary, while HP Inc. has faced challenges, Microchip Technology's consistent growth highlights its robust market strategy.
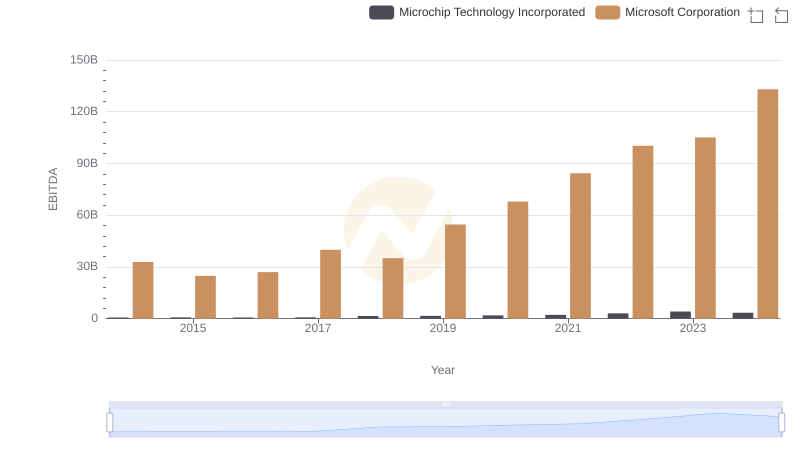
EBITDA Performance Review: Microsoft Corporation vs Microchip Technology Incorporated
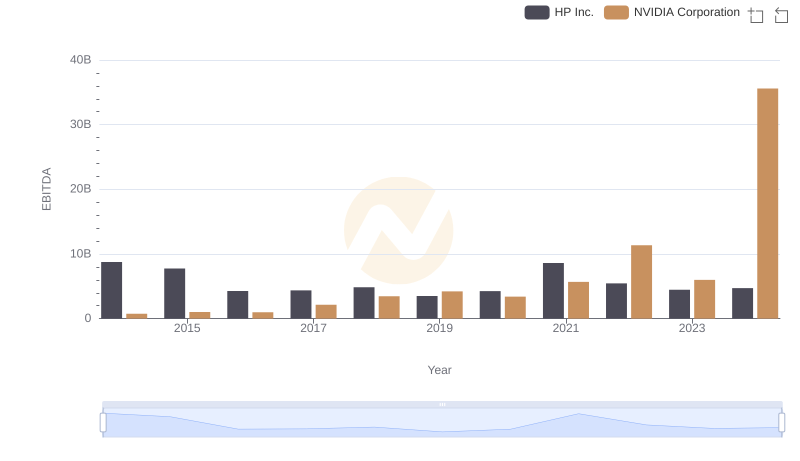
A Professional Review of EBITDA: NVIDIA Corporation Compared to HP Inc.
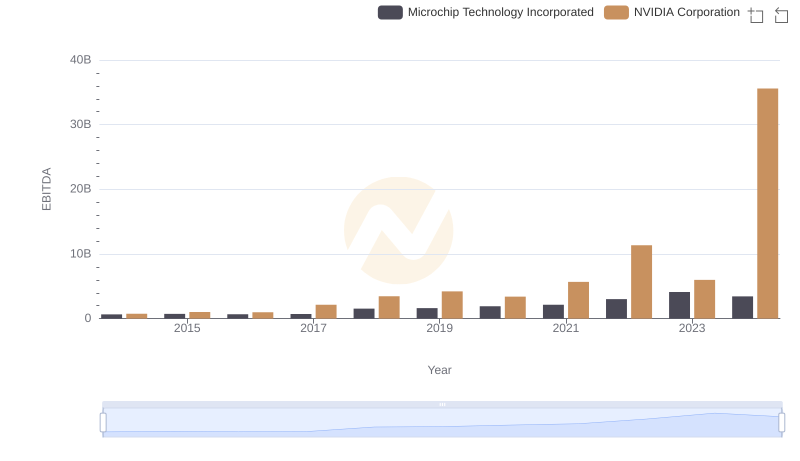
NVIDIA Corporation and Microchip Technology Incorporated: A Detailed Examination of EBITDA Performance
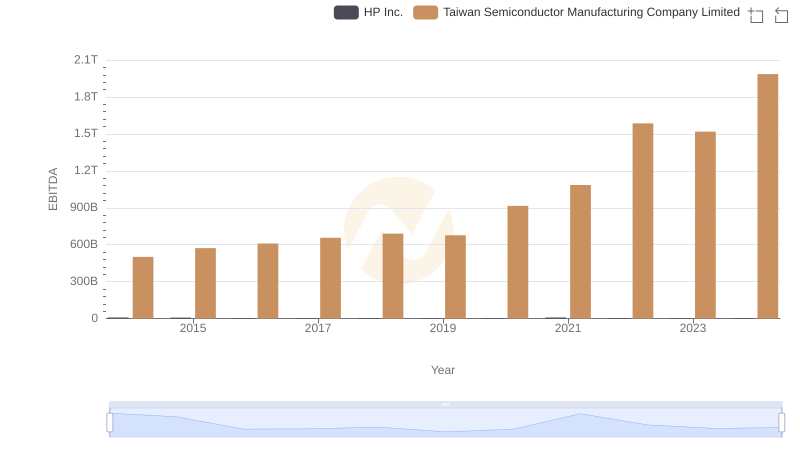
Comparative EBITDA Analysis: Taiwan Semiconductor Manufacturing Company Limited vs HP Inc.
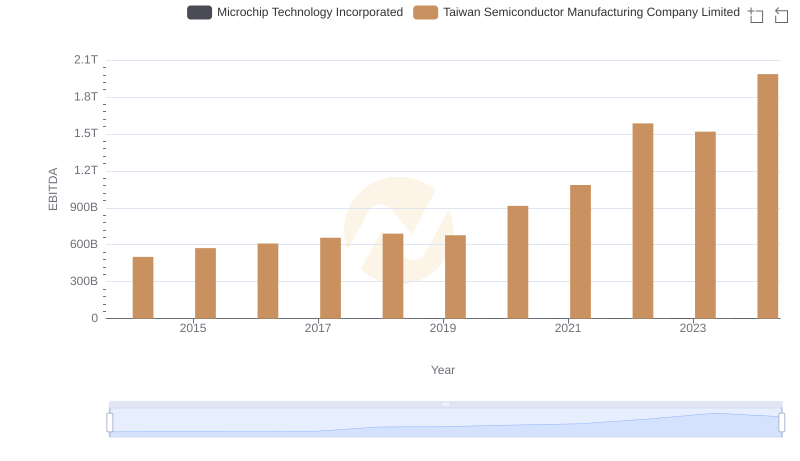
EBITDA Analysis: Evaluating Taiwan Semiconductor Manufacturing Company Limited Against Microchip Technology Incorporated
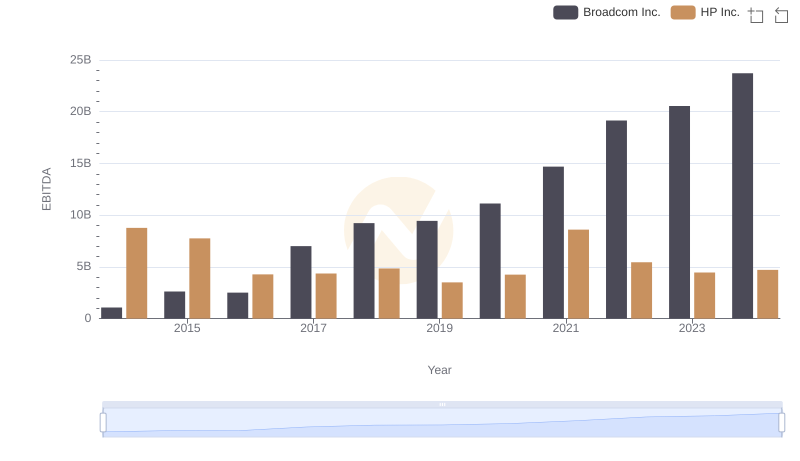
Broadcom Inc. vs HP Inc.: In-Depth EBITDA Performance Comparison
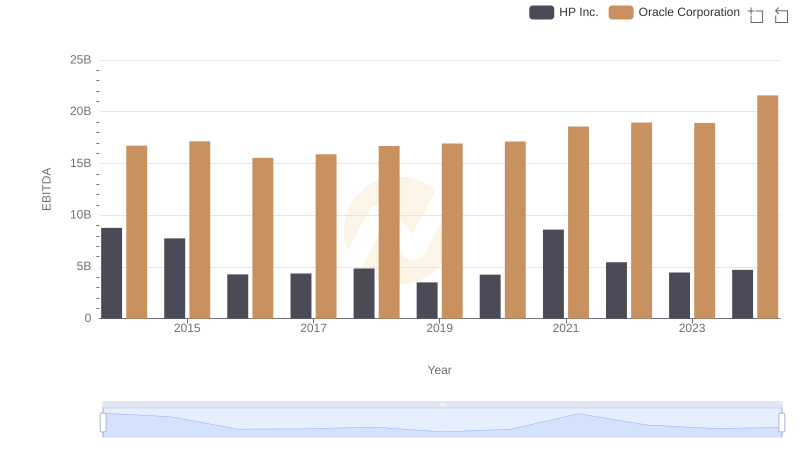
Comparative EBITDA Analysis: Oracle Corporation vs HP Inc.
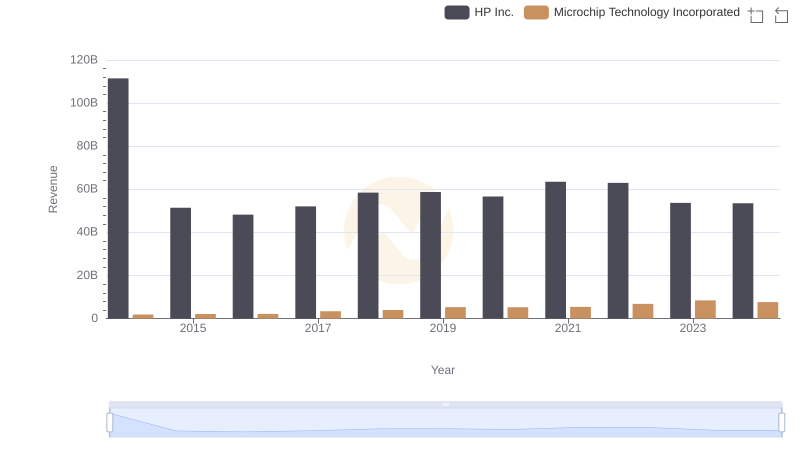
Breaking Down Revenue Trends: HP Inc. vs Microchip Technology Incorporated
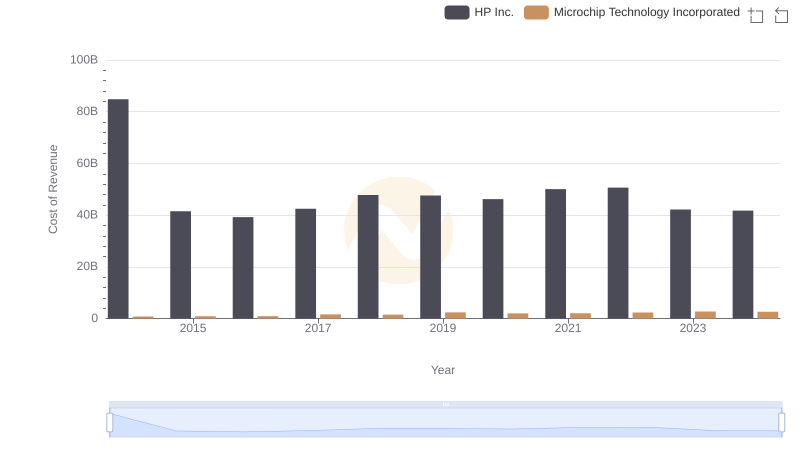
Cost of Revenue Comparison: HP Inc. vs Microchip Technology Incorporated
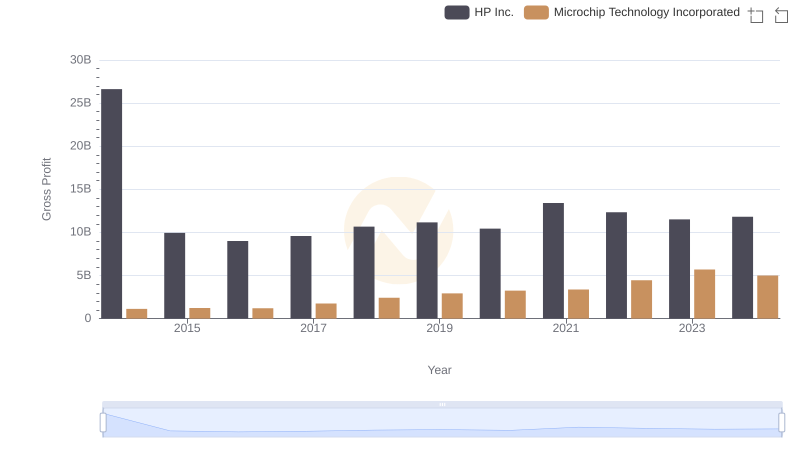
HP Inc. and Microchip Technology Incorporated: A Detailed Gross Profit Analysis
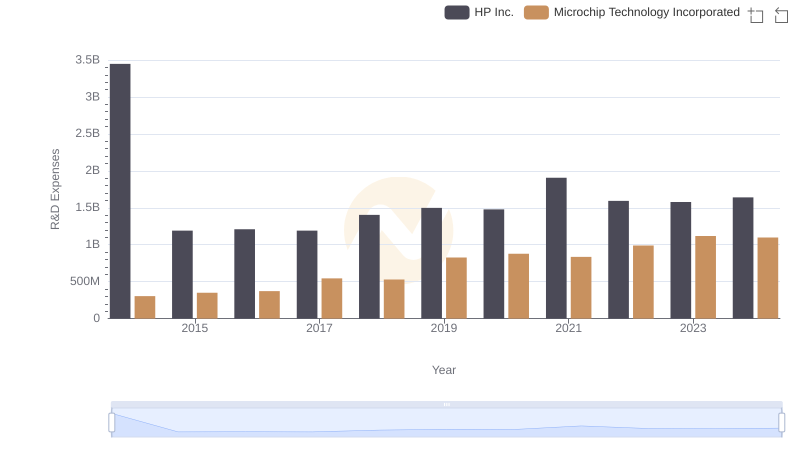
Comparing Innovation Spending: HP Inc. and Microchip Technology Incorporated
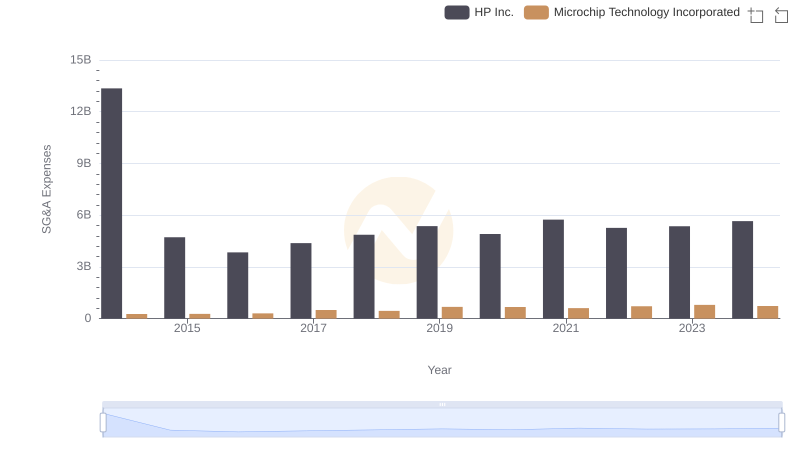
Comparing SG&A Expenses: HP Inc. vs Microchip Technology Incorporated Trends and Insights