| __timestamp | HP Inc. | Microchip Technology Incorporated |
|---|---|---|
| Wednesday, January 1, 2014 | 26615000000 | 1128743000 |
| Thursday, January 1, 2015 | 9939000000 | 1229564000 |
| Friday, January 1, 2016 | 8998000000 | 1205464000 |
| Sunday, January 1, 2017 | 9578000000 | 1757196000 |
| Monday, January 1, 2018 | 10669000000 | 2420700000 |
| Tuesday, January 1, 2019 | 11170000000 | 2931300000 |
| Wednesday, January 1, 2020 | 10437000000 | 3242100000 |
| Friday, January 1, 2021 | 13417000000 | 3378800000 |
| Saturday, January 1, 2022 | 12335000000 | 4449600000 |
| Sunday, January 1, 2023 | 11508000000 | 5697900000 |
| Monday, January 1, 2024 | 11818000000 | 4995700000 |
Igniting the spark of knowledge
In the ever-evolving landscape of technology, HP Inc. and Microchip Technology Incorporated have carved distinct paths. From 2014 to 2024, HP Inc. has consistently demonstrated its prowess, with gross profits peaking in 2014 and showing a steady trend thereafter. Despite a dip in 2016, HP's gross profit rebounded, maintaining an average of $12.4 billion annually. Meanwhile, Microchip Technology has shown remarkable growth, with its gross profit increasing by over 400% from 2014 to 2023. This growth trajectory highlights Microchip's strategic advancements in the semiconductor industry.
These trends underscore the dynamic nature of the tech industry, where innovation and strategy drive financial success.
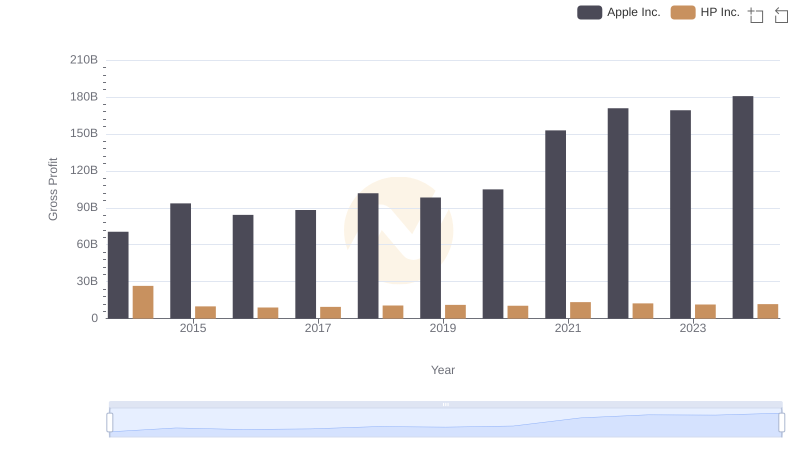
Key Insights on Gross Profit: Apple Inc. vs HP Inc.
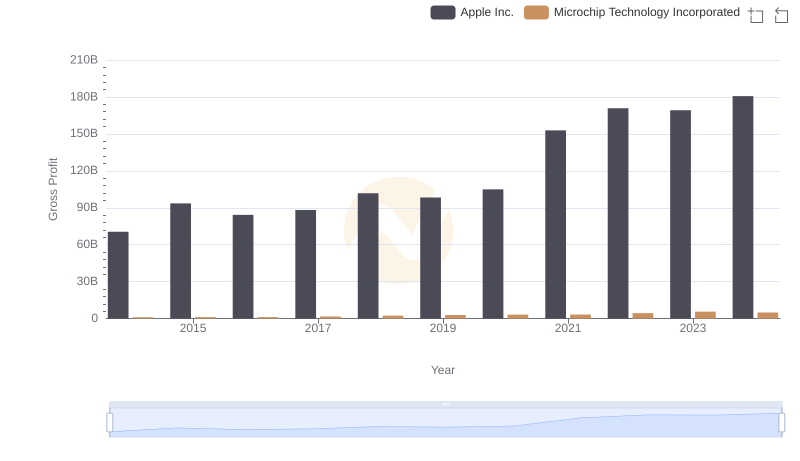
Key Insights on Gross Profit: Apple Inc. vs Microchip Technology Incorporated
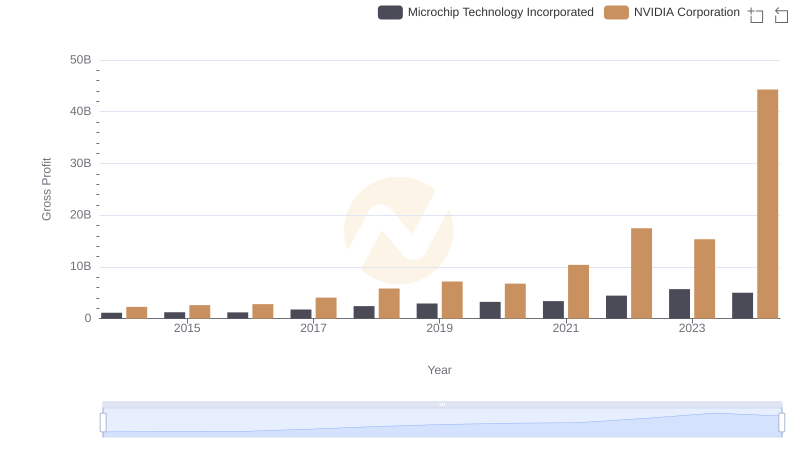
Key Insights on Gross Profit: NVIDIA Corporation vs Microchip Technology Incorporated
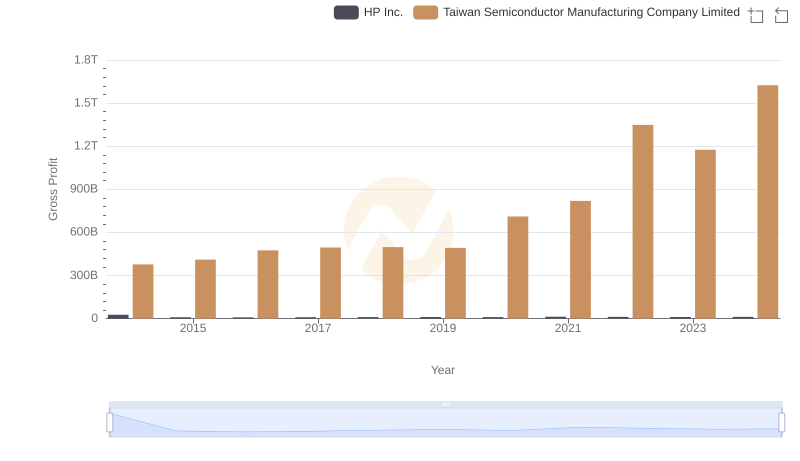
Key Insights on Gross Profit: Taiwan Semiconductor Manufacturing Company Limited vs HP Inc.
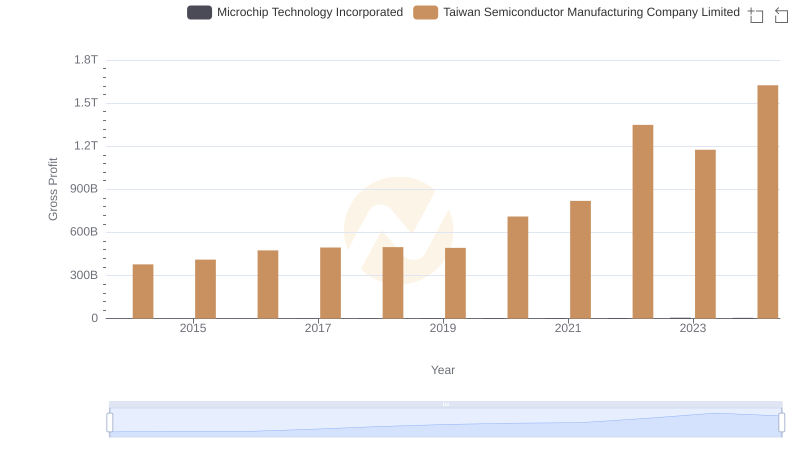
Gross Profit Analysis: Comparing Taiwan Semiconductor Manufacturing Company Limited and Microchip Technology Incorporated
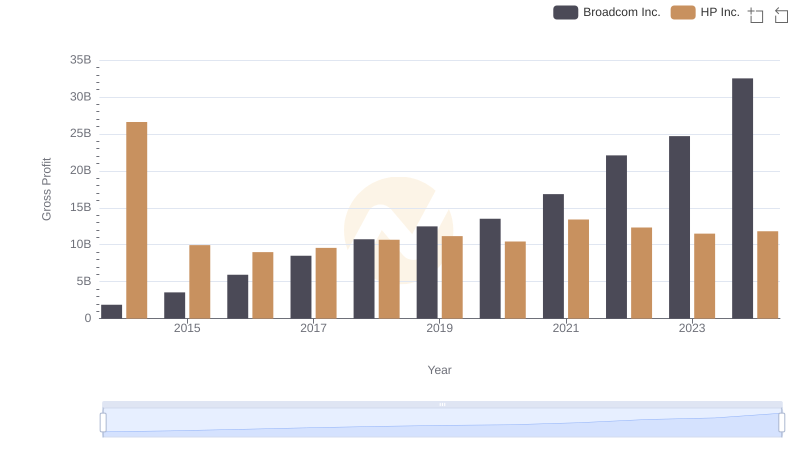
Gross Profit Trends Compared: Broadcom Inc. vs HP Inc.
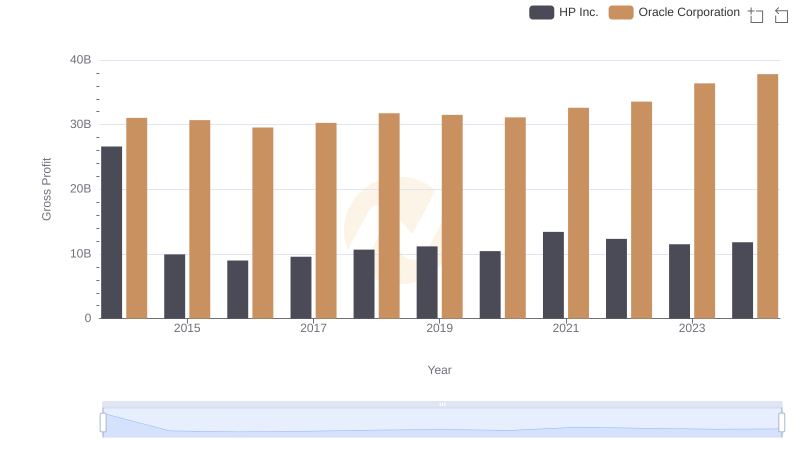
Key Insights on Gross Profit: Oracle Corporation vs HP Inc.
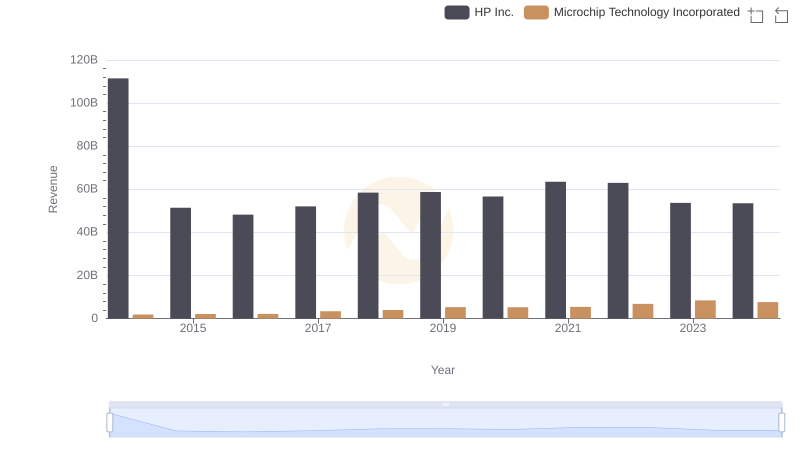
Breaking Down Revenue Trends: HP Inc. vs Microchip Technology Incorporated
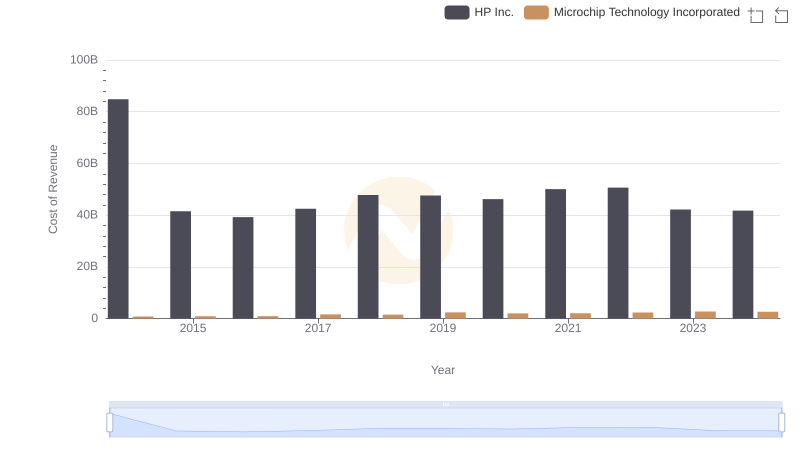
Cost of Revenue Comparison: HP Inc. vs Microchip Technology Incorporated
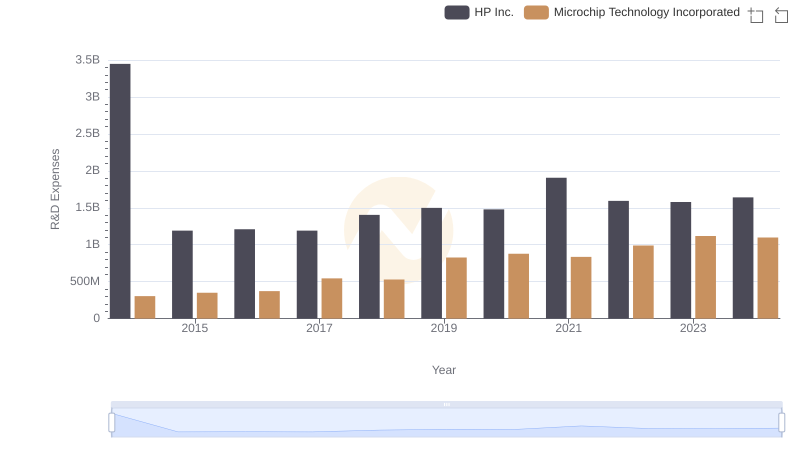
Comparing Innovation Spending: HP Inc. and Microchip Technology Incorporated
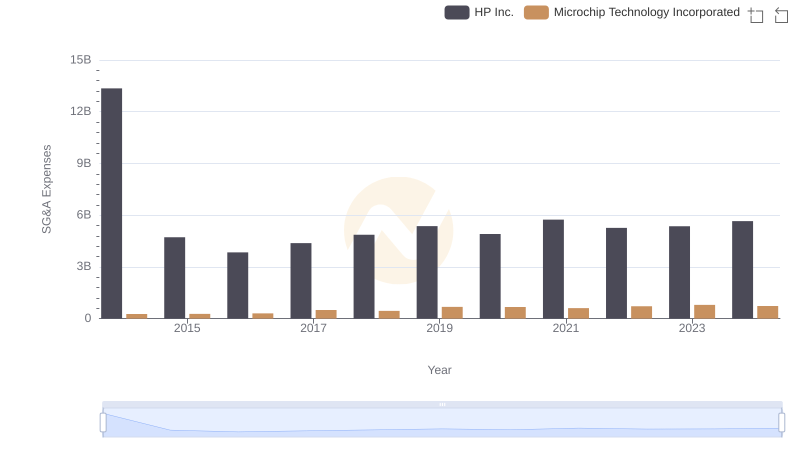
Comparing SG&A Expenses: HP Inc. vs Microchip Technology Incorporated Trends and Insights
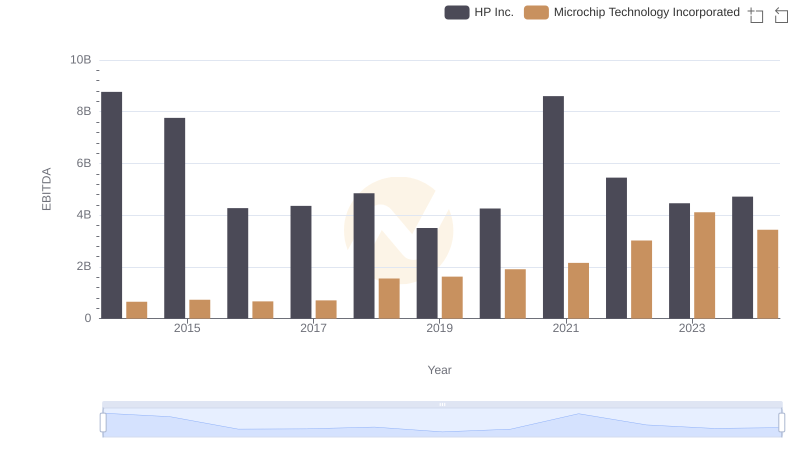
EBITDA Performance Review: HP Inc. vs Microchip Technology Incorporated