| __timestamp | HP Inc. | Microchip Technology Incorporated |
|---|---|---|
| Wednesday, January 1, 2014 | 111454000000 | 1931217000 |
| Thursday, January 1, 2015 | 51463000000 | 2147036000 |
| Friday, January 1, 2016 | 48238000000 | 2173334000 |
| Sunday, January 1, 2017 | 52056000000 | 3407807000 |
| Monday, January 1, 2018 | 58472000000 | 3980800000 |
| Tuesday, January 1, 2019 | 58756000000 | 5349500000 |
| Wednesday, January 1, 2020 | 56639000000 | 5274200000 |
| Friday, January 1, 2021 | 63487000000 | 5438400000 |
| Saturday, January 1, 2022 | 62983000000 | 6820900000 |
| Sunday, January 1, 2023 | 53718000000 | 8438700000 |
| Monday, January 1, 2024 | 53559000000 | 7634400000 |
In pursuit of knowledge
In the ever-evolving landscape of technology, understanding revenue trends is crucial for investors and industry enthusiasts alike. Over the past decade, HP Inc. and Microchip Technology Incorporated have showcased distinct revenue trajectories. From 2014 to 2024, HP Inc. experienced a notable revenue decline of approximately 52%, starting from a peak in 2014. In contrast, Microchip Technology's revenue surged by around 295% during the same period, reflecting its robust growth strategy.
HP Inc.'s revenue fluctuations highlight the challenges faced by traditional tech giants in adapting to new market demands. Meanwhile, Microchip Technology's consistent upward trend underscores the growing importance of semiconductor solutions in the digital age. As we move forward, these trends offer valuable insights into the shifting dynamics of the tech industry, emphasizing the need for innovation and adaptability.
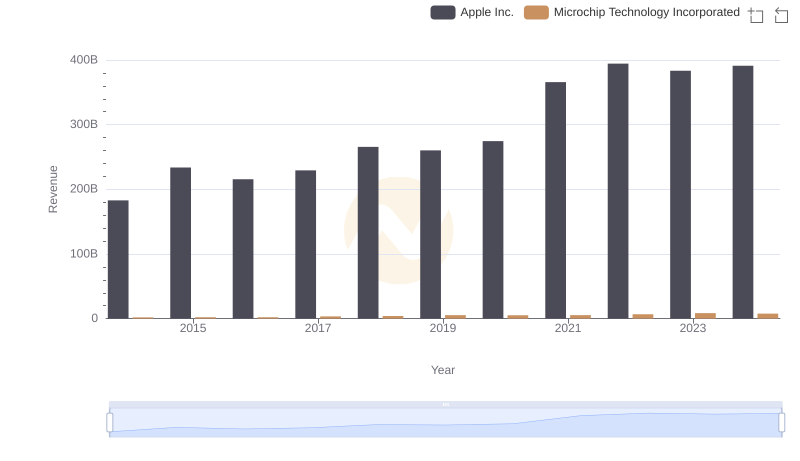
Revenue Showdown: Apple Inc. vs Microchip Technology Incorporated
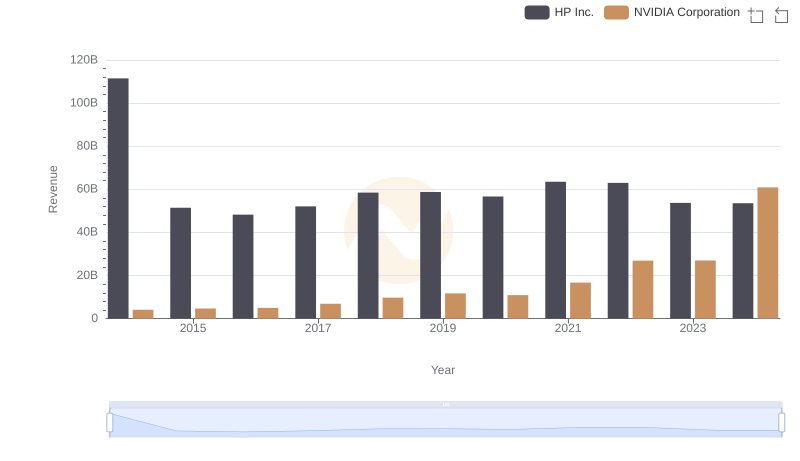
Comparing Revenue Performance: NVIDIA Corporation or HP Inc.?
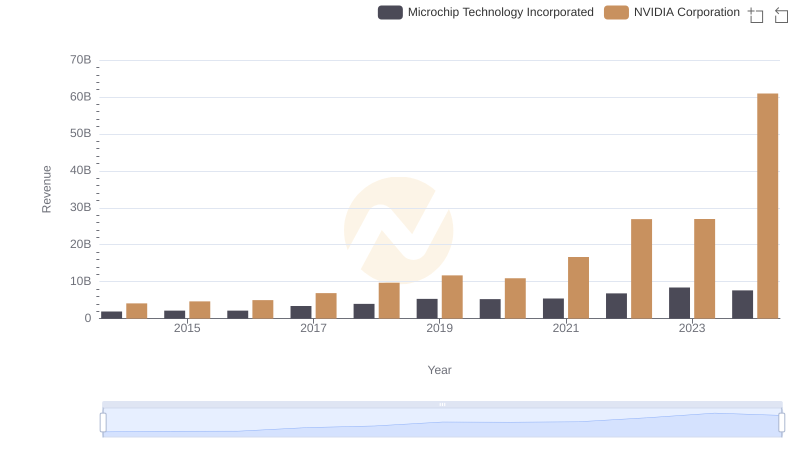
NVIDIA Corporation and Microchip Technology Incorporated: A Comprehensive Revenue Analysis
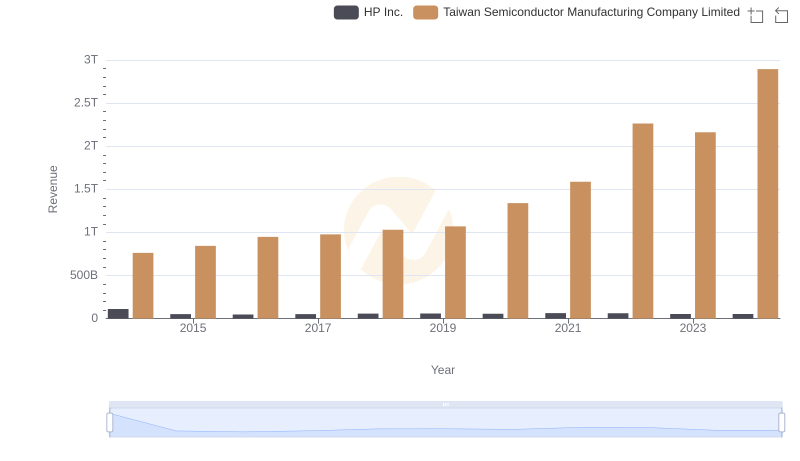
Taiwan Semiconductor Manufacturing Company Limited and HP Inc.: A Comprehensive Revenue Analysis

Taiwan Semiconductor Manufacturing Company Limited vs Microchip Technology Incorporated: Examining Key Revenue Metrics
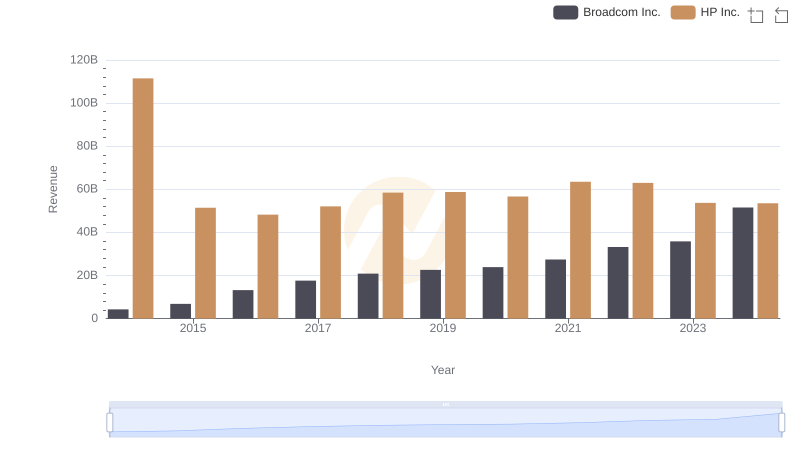
Broadcom Inc. vs HP Inc.: Annual Revenue Growth Compared
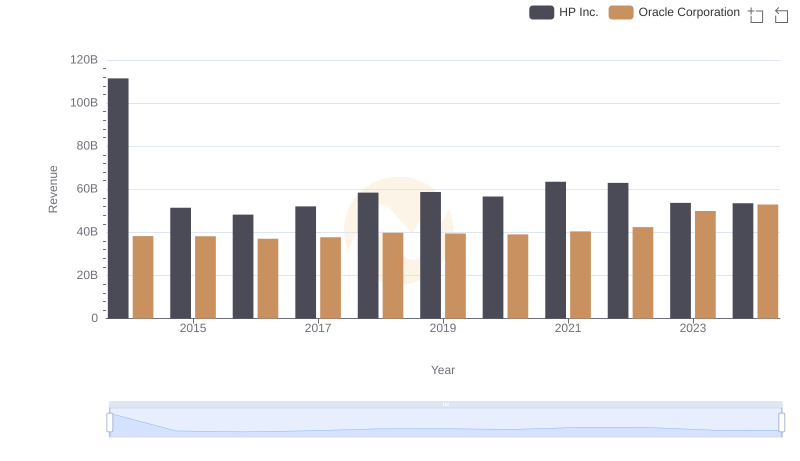
Breaking Down Revenue Trends: Oracle Corporation vs HP Inc.
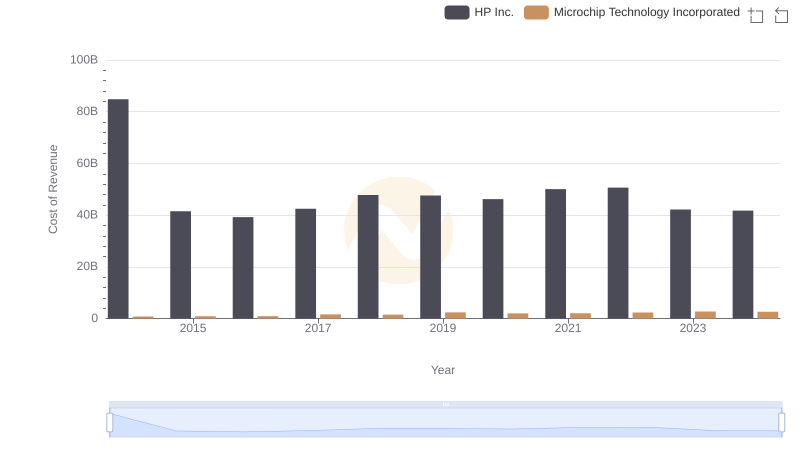
Cost of Revenue Comparison: HP Inc. vs Microchip Technology Incorporated
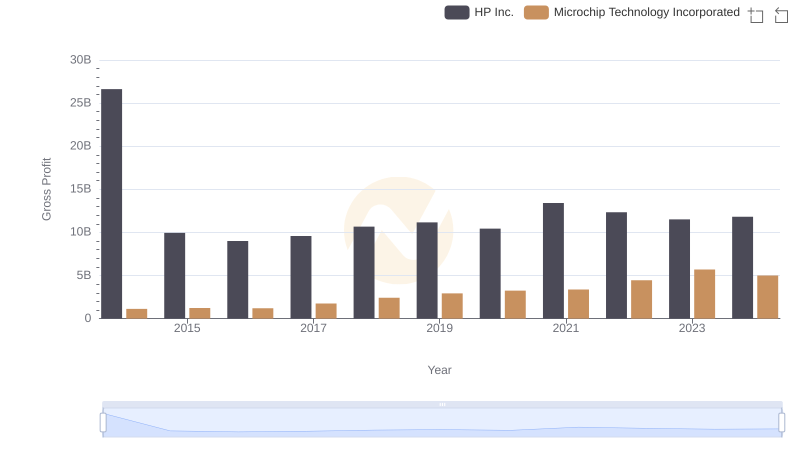
HP Inc. and Microchip Technology Incorporated: A Detailed Gross Profit Analysis
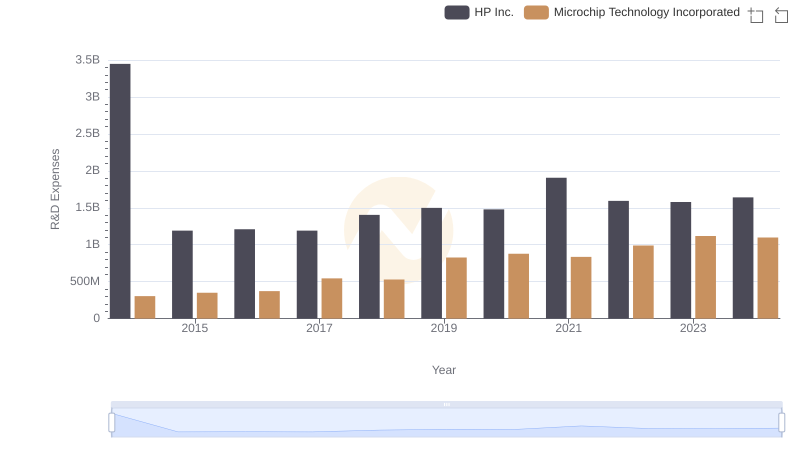
Comparing Innovation Spending: HP Inc. and Microchip Technology Incorporated
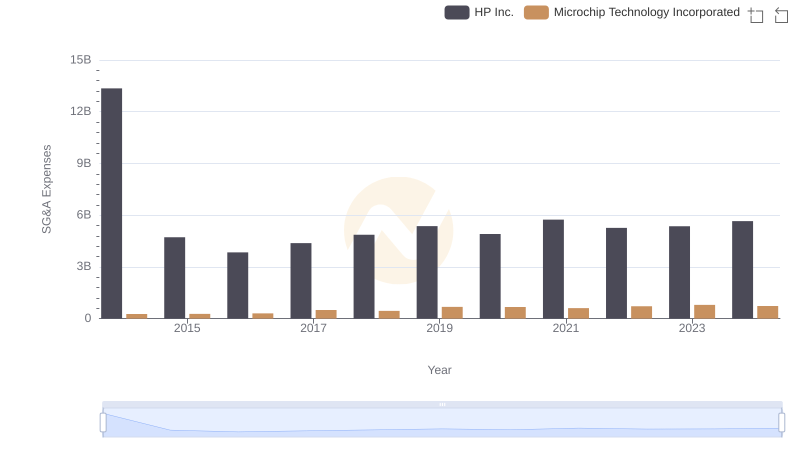
Comparing SG&A Expenses: HP Inc. vs Microchip Technology Incorporated Trends and Insights
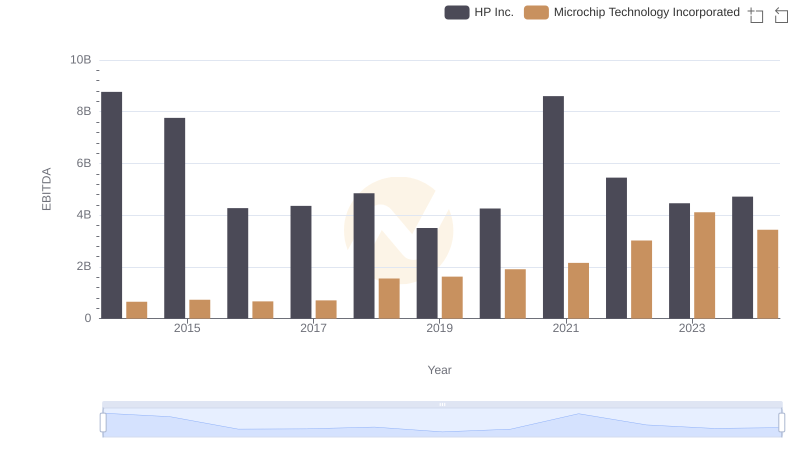
EBITDA Performance Review: HP Inc. vs Microchip Technology Incorporated