| __timestamp | HP Inc. | Microchip Technology Incorporated |
|---|---|---|
| Wednesday, January 1, 2014 | 84839000000 | 802474000 |
| Thursday, January 1, 2015 | 41524000000 | 917472000 |
| Friday, January 1, 2016 | 39240000000 | 967870000 |
| Sunday, January 1, 2017 | 42478000000 | 1650611000 |
| Monday, January 1, 2018 | 47803000000 | 1560100000 |
| Tuesday, January 1, 2019 | 47586000000 | 2418200000 |
| Wednesday, January 1, 2020 | 46202000000 | 2032100000 |
| Friday, January 1, 2021 | 50070000000 | 2059600000 |
| Saturday, January 1, 2022 | 50648000000 | 2371300000 |
| Sunday, January 1, 2023 | 42210000000 | 2740800000 |
| Monday, January 1, 2024 | 41741000000 | 2638700000 |
Cracking the code
In the ever-evolving landscape of technology, HP Inc. and Microchip Technology Incorporated stand as titans, each with a unique narrative in cost management. Over the past decade, HP Inc. has consistently maintained a cost of revenue that dwarfs that of Microchip Technology, with figures often exceeding 40 billion annually. This reflects HP's expansive operations and market reach. In contrast, Microchip Technology's cost of revenue, while significantly smaller, has shown a steady upward trend, growing by over 200% from 2014 to 2023. This growth underscores Microchip's strategic expansion and increasing market penetration. The data reveals a fascinating juxtaposition: HP's cost of revenue peaked in 2014, while Microchip's has been on a consistent rise, highlighting different growth strategies. As we look to the future, these trends offer insights into the operational efficiencies and market strategies of these industry leaders.
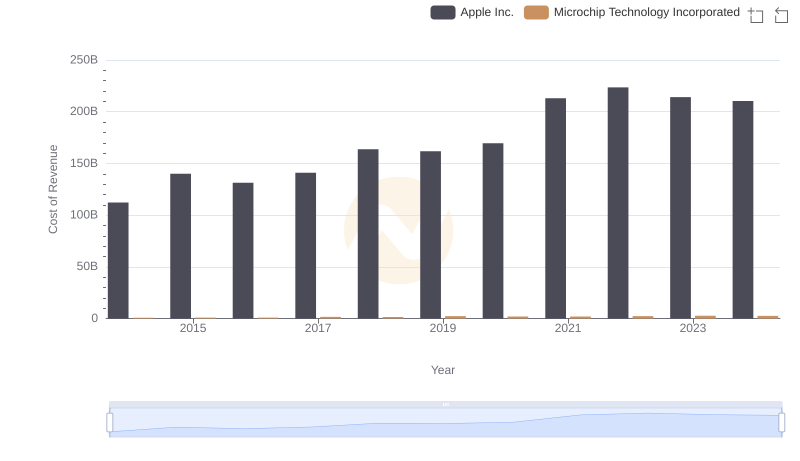
Apple Inc. vs Microchip Technology Incorporated: Efficiency in Cost of Revenue Explored
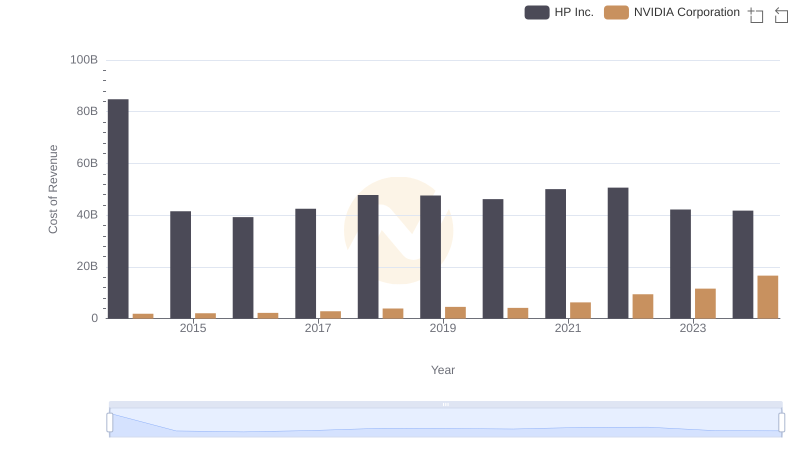
Cost Insights: Breaking Down NVIDIA Corporation and HP Inc.'s Expenses
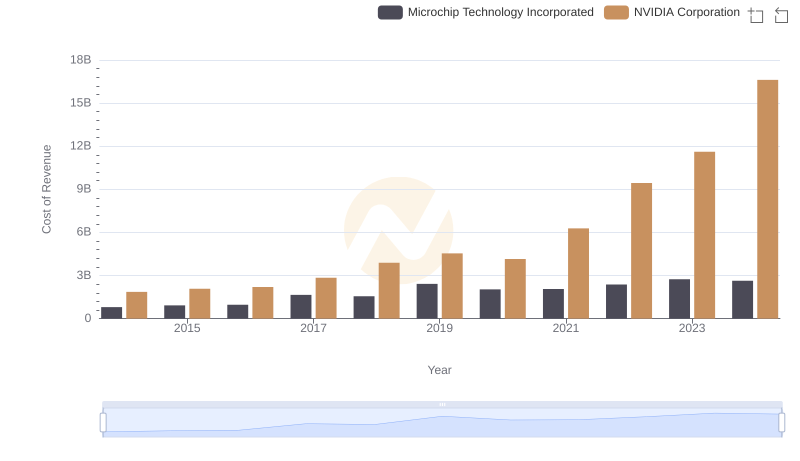
NVIDIA Corporation vs Microchip Technology Incorporated: Efficiency in Cost of Revenue Explored
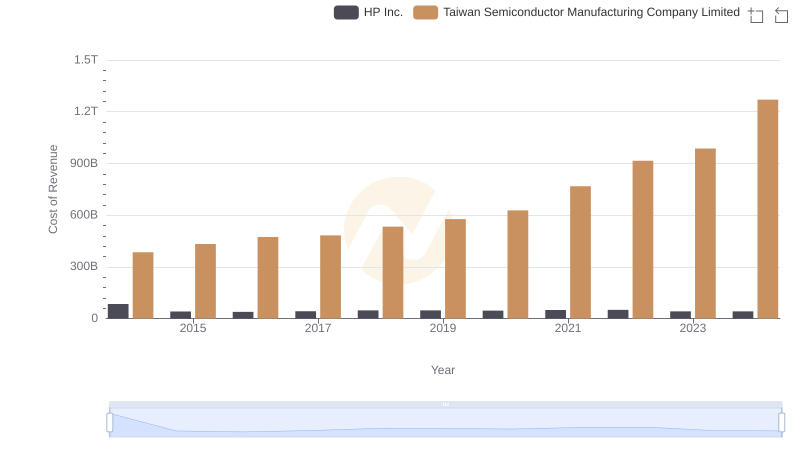
Cost of Revenue Comparison: Taiwan Semiconductor Manufacturing Company Limited vs HP Inc.
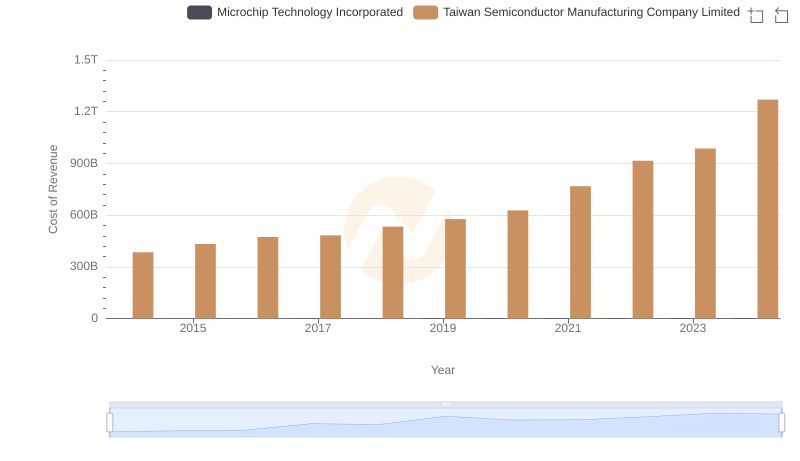
Cost of Revenue Comparison: Taiwan Semiconductor Manufacturing Company Limited vs Microchip Technology Incorporated
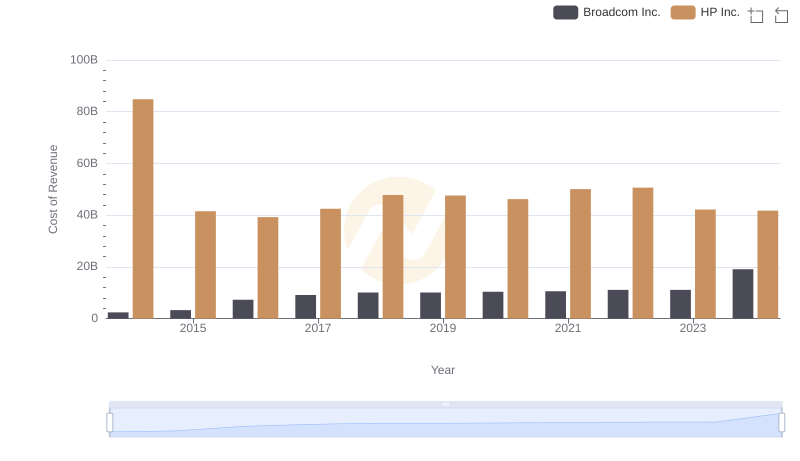
Cost Insights: Breaking Down Broadcom Inc. and HP Inc.'s Expenses
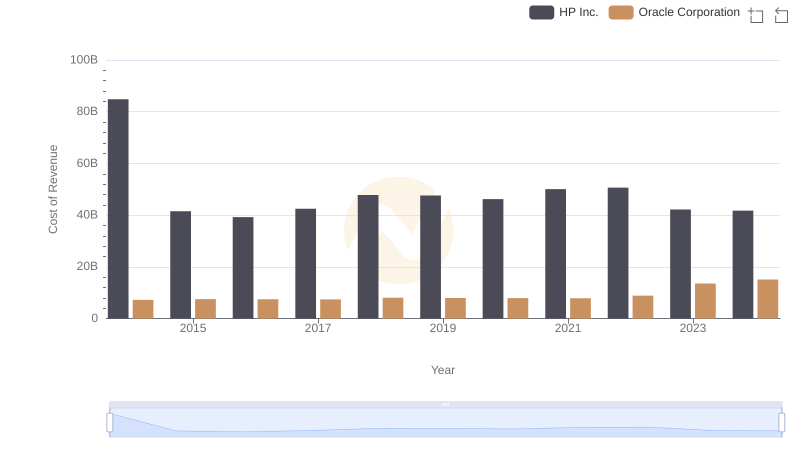
Analyzing Cost of Revenue: Oracle Corporation and HP Inc.
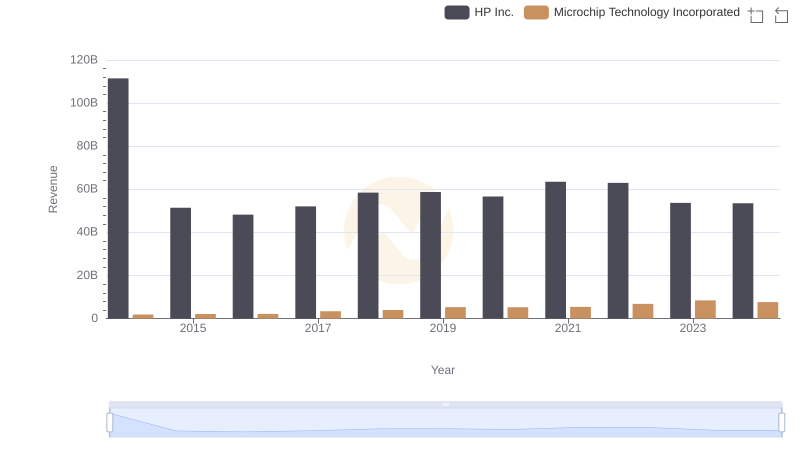
Breaking Down Revenue Trends: HP Inc. vs Microchip Technology Incorporated
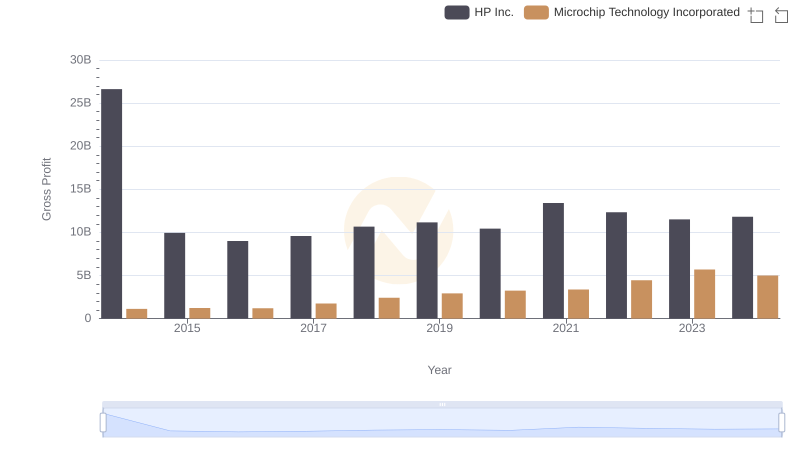
HP Inc. and Microchip Technology Incorporated: A Detailed Gross Profit Analysis
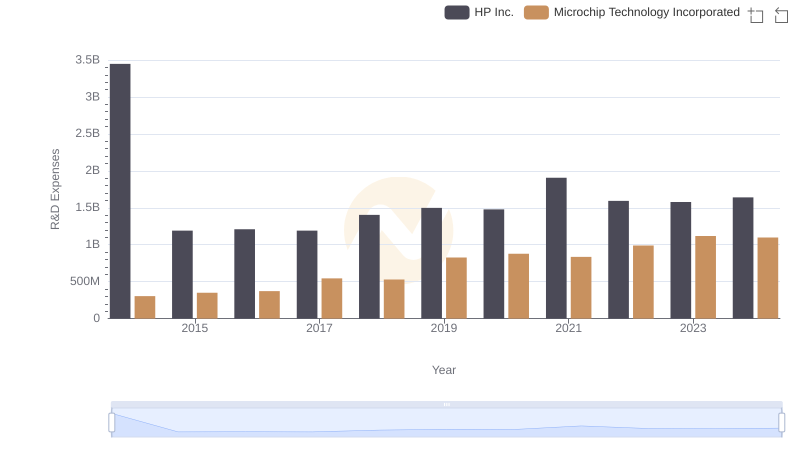
Comparing Innovation Spending: HP Inc. and Microchip Technology Incorporated
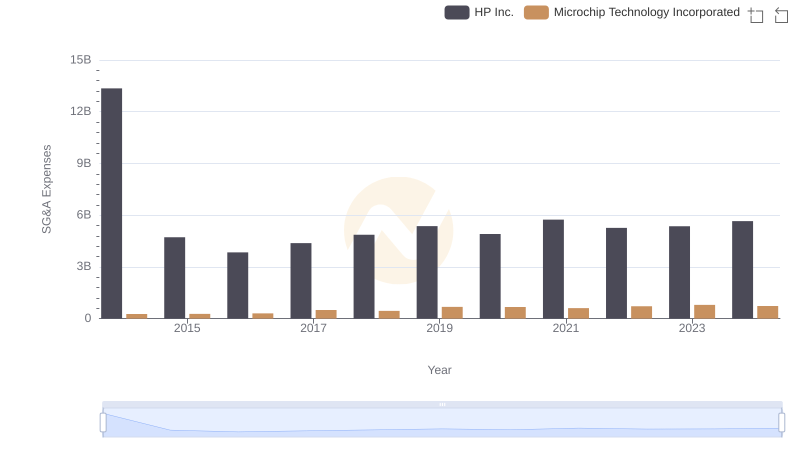
Comparing SG&A Expenses: HP Inc. vs Microchip Technology Incorporated Trends and Insights
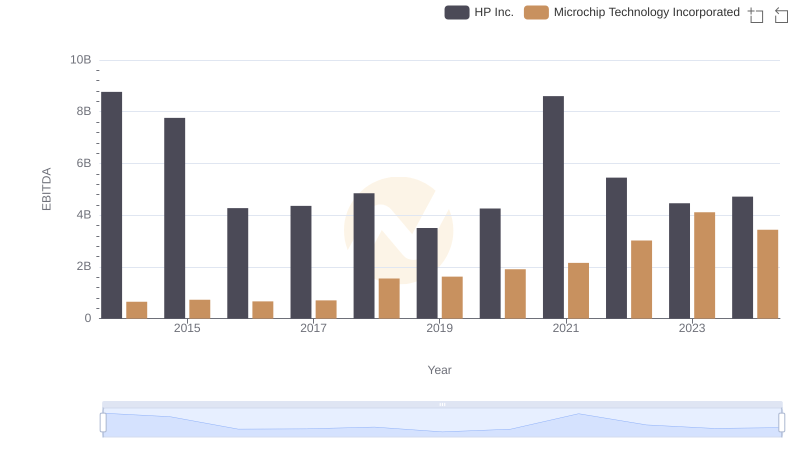
EBITDA Performance Review: HP Inc. vs Microchip Technology Incorporated