| __timestamp | Caterpillar Inc. | Deere & Company |
|---|---|---|
| Wednesday, January 1, 2014 | 5697000000 | 3284400000 |
| Thursday, January 1, 2015 | 4951000000 | 2873300000 |
| Friday, January 1, 2016 | 4686000000 | 2763700000 |
| Sunday, January 1, 2017 | 5177000000 | 3066600000 |
| Monday, January 1, 2018 | 5478000000 | 3455500000 |
| Tuesday, January 1, 2019 | 5162000000 | 3551000000 |
| Wednesday, January 1, 2020 | 4642000000 | 3477000000 |
| Friday, January 1, 2021 | 5365000000 | 3383000000 |
| Saturday, January 1, 2022 | 5651000000 | 3863000000 |
| Sunday, January 1, 2023 | 6371000000 | 3601000000 |
| Monday, January 1, 2024 | 6667000000 | 4507000000 |
Unleashing the power of data
In the competitive landscape of heavy machinery, operational efficiency is paramount. Over the past decade, Caterpillar Inc. and Deere & Company have showcased distinct strategies in managing their Selling, General, and Administrative (SG&A) expenses. From 2014 to 2023, Caterpillar's SG&A expenses fluctuated, peaking in 2023 with a 36% increase from its 2016 low. Meanwhile, Deere & Company maintained a steadier trajectory, with a notable 63% rise from 2016 to 2024, despite missing data for Caterpillar in 2024. This analysis highlights Caterpillar's aggressive cost management in the mid-2010s, contrasted with Deere's consistent growth strategy. As these industry titans navigate economic shifts, their SG&A trends offer insights into their operational priorities and market adaptability.

Revenue Insights: Caterpillar Inc. and Deere & Company Performance Compared
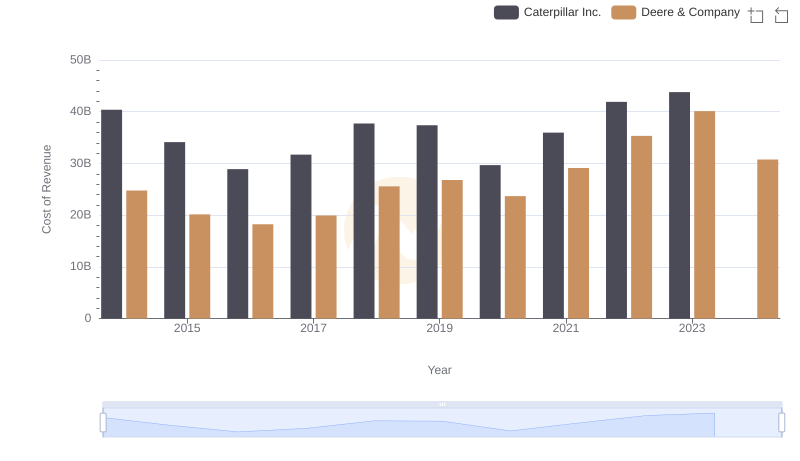
Comparing Cost of Revenue Efficiency: Caterpillar Inc. vs Deere & Company

Caterpillar Inc. vs Deere & Company: Strategic Focus on R&D Spending

Cost Management Insights: SG&A Expenses for Caterpillar Inc. and The Boeing Company

SG&A Efficiency Analysis: Comparing Caterpillar Inc. and Honeywell International Inc.
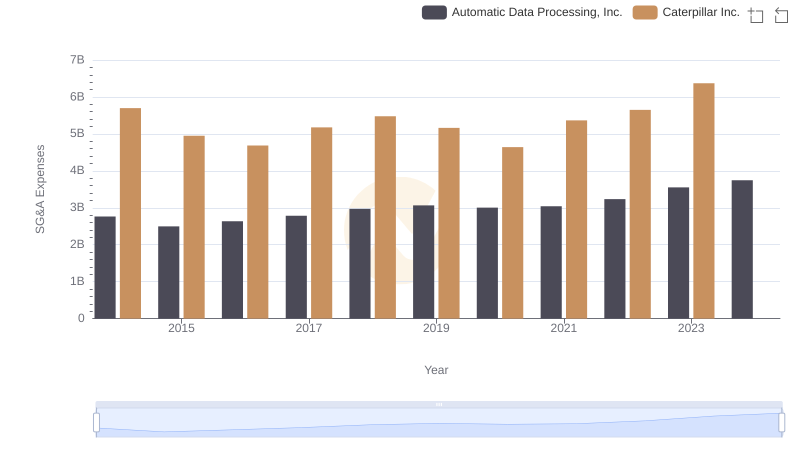
Who Optimizes SG&A Costs Better? Caterpillar Inc. or Automatic Data Processing, Inc.
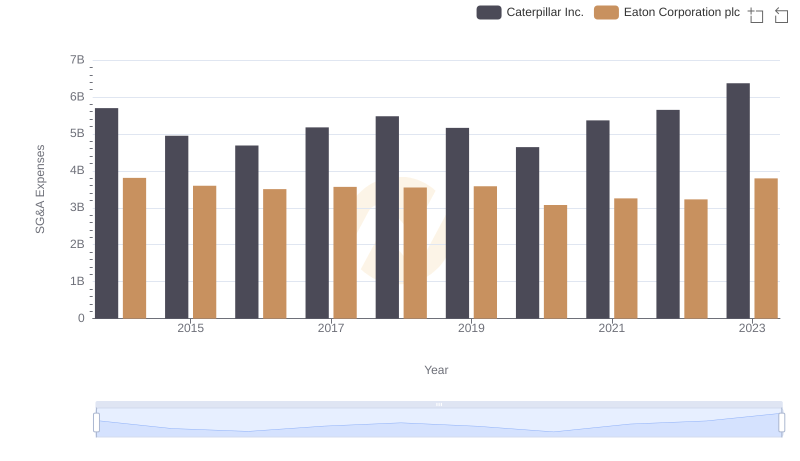
Caterpillar Inc. or Eaton Corporation plc: Who Manages SG&A Costs Better?
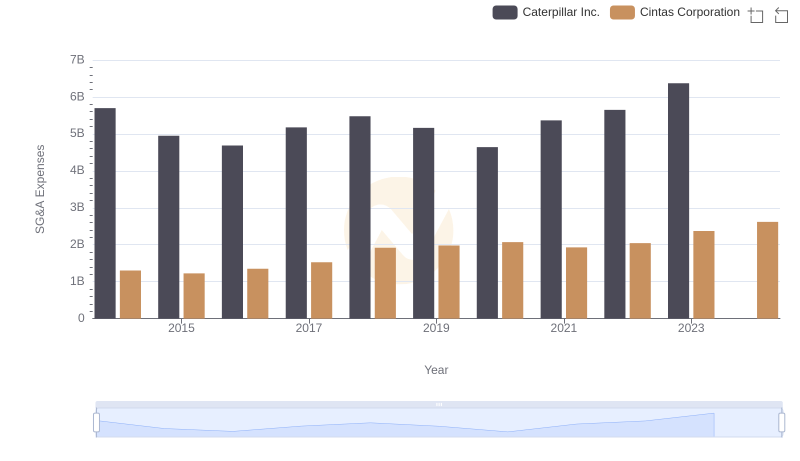
Comparing SG&A Expenses: Caterpillar Inc. vs Cintas Corporation Trends and Insights