| __timestamp | Caterpillar Inc. | Cintas Corporation |
|---|---|---|
| Wednesday, January 1, 2014 | 5697000000 | 1302752000 |
| Thursday, January 1, 2015 | 4951000000 | 1224930000 |
| Friday, January 1, 2016 | 4686000000 | 1348122000 |
| Sunday, January 1, 2017 | 5177000000 | 1527380000 |
| Monday, January 1, 2018 | 5478000000 | 1916792000 |
| Tuesday, January 1, 2019 | 5162000000 | 1980644000 |
| Wednesday, January 1, 2020 | 4642000000 | 2071052000 |
| Friday, January 1, 2021 | 5365000000 | 1929159000 |
| Saturday, January 1, 2022 | 5651000000 | 2044876000 |
| Sunday, January 1, 2023 | 6371000000 | 2370704000 |
| Monday, January 1, 2024 | 6667000000 | 2617783000 |
Unleashing the power of data
In the world of industrial and service sectors, Caterpillar Inc. and Cintas Corporation stand as titans, each with a unique trajectory in their Selling, General, and Administrative (SG&A) expenses over the past decade. From 2014 to 2023, Caterpillar's SG&A expenses fluctuated, peaking in 2023 with a 12% increase from 2022, reflecting strategic investments and market expansion. Meanwhile, Cintas Corporation exhibited a steady upward trend, with a remarkable 98% growth in SG&A expenses from 2014 to 2023, underscoring its aggressive market penetration and operational scaling. Notably, 2024 data for Caterpillar is missing, leaving room for speculation on its future financial strategies. This comparative analysis offers a window into the financial strategies of these industry leaders, highlighting their adaptive approaches in a dynamic economic landscape.

SG&A Efficiency Analysis: Comparing Caterpillar Inc. and Honeywell International Inc.
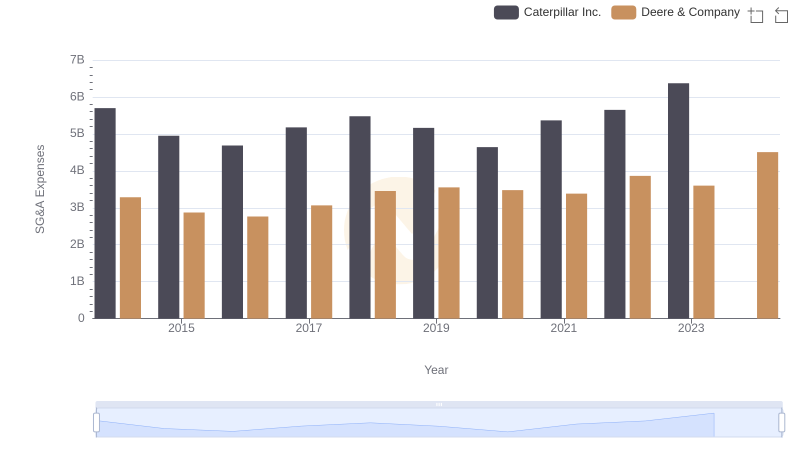
Operational Costs Compared: SG&A Analysis of Caterpillar Inc. and Deere & Company
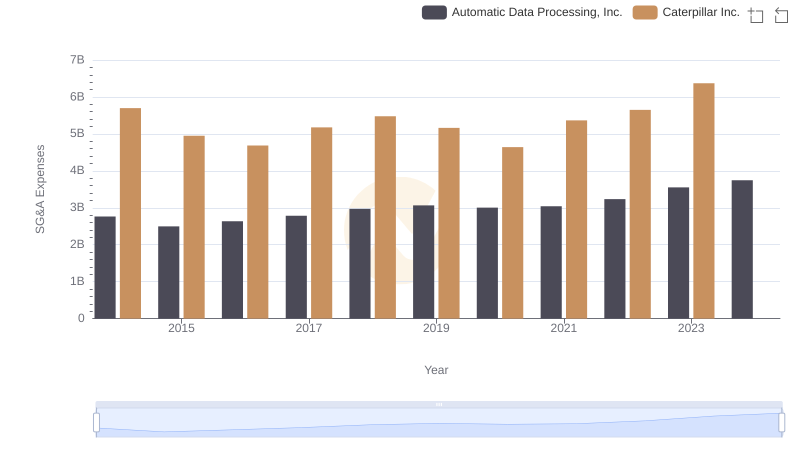
Who Optimizes SG&A Costs Better? Caterpillar Inc. or Automatic Data Processing, Inc.
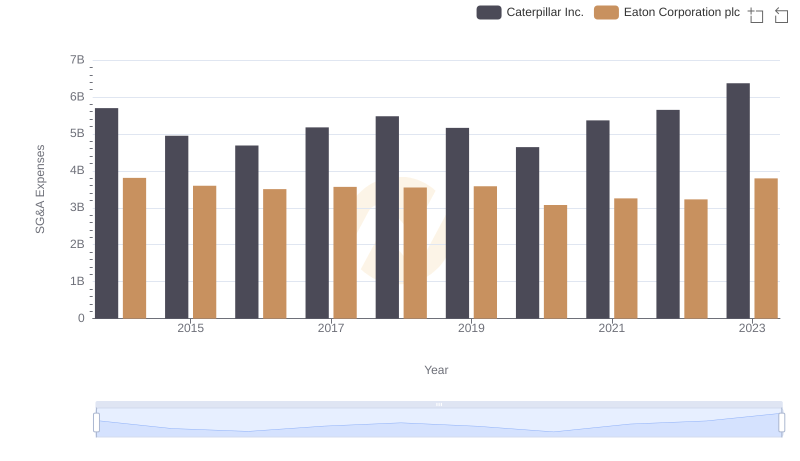
Caterpillar Inc. or Eaton Corporation plc: Who Manages SG&A Costs Better?
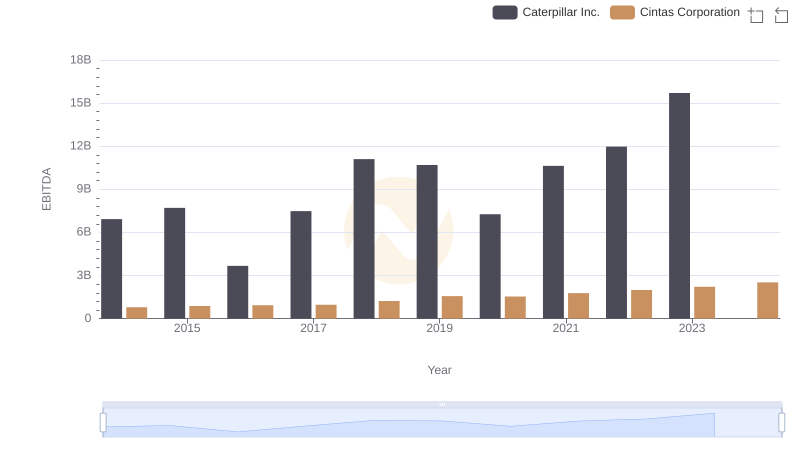
A Professional Review of EBITDA: Caterpillar Inc. Compared to Cintas Corporation