| __timestamp | Union Pacific Corporation | Verisk Analytics, Inc. |
|---|---|---|
| Wednesday, January 1, 2014 | 23988000000 | 1746726000 |
| Thursday, January 1, 2015 | 21813000000 | 2068010000 |
| Friday, January 1, 2016 | 19941000000 | 1995200000 |
| Sunday, January 1, 2017 | 21240000000 | 2145200000 |
| Monday, January 1, 2018 | 22832000000 | 2395100000 |
| Tuesday, January 1, 2019 | 21708000000 | 2607100000 |
| Wednesday, January 1, 2020 | 19533000000 | 2784600000 |
| Friday, January 1, 2021 | 21804000000 | 2998600000 |
| Saturday, January 1, 2022 | 24875000000 | 2497000000 |
| Sunday, January 1, 2023 | 24119000000 | 2681400000 |
| Monday, January 1, 2024 | 24250000000 |
In pursuit of knowledge
In the ever-evolving landscape of American industry, Union Pacific Corporation and Verisk Analytics, Inc. stand as titans in their respective fields. Over the past decade, Union Pacific, a stalwart in the transportation sector, has consistently outpaced Verisk, a leader in data analytics, in terms of revenue. From 2014 to 2023, Union Pacific's revenue has shown a robust growth trend, peaking in 2022 with a 27% increase from its 2016 low. Meanwhile, Verisk Analytics has demonstrated a steady upward trajectory, achieving a 71% revenue increase over the same period. Notably, 2020 marked a challenging year for both companies, with Union Pacific experiencing a dip to its lowest revenue point in the decade. As we look to 2024, Union Pacific's data remains incomplete, leaving room for speculation on its future performance. This comparison highlights the dynamic nature of these industries and the resilience of these corporations.
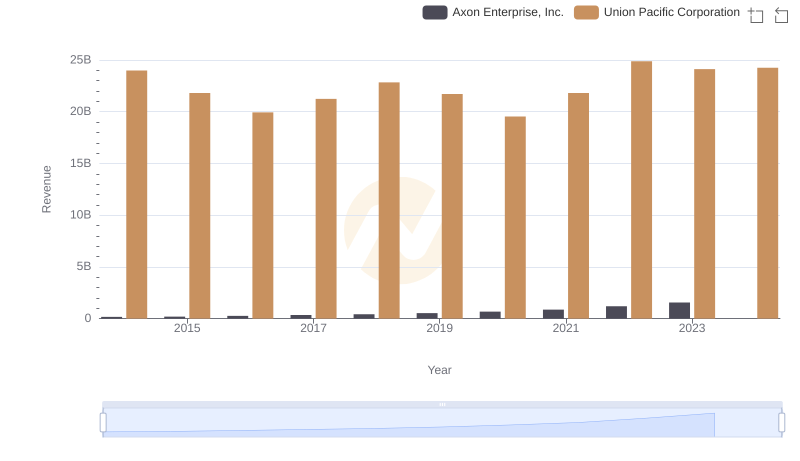
Union Pacific Corporation or Axon Enterprise, Inc.: Who Leads in Yearly Revenue?

Comparing Revenue Performance: Union Pacific Corporation or AMETEK, Inc.?
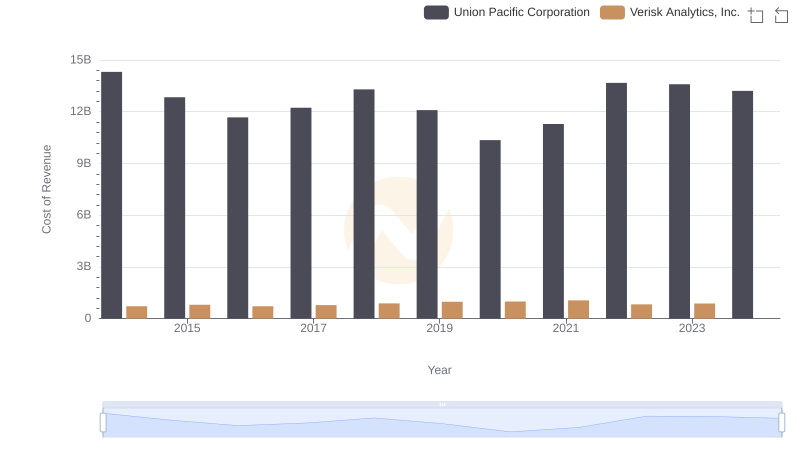
Cost of Revenue Trends: Union Pacific Corporation vs Verisk Analytics, Inc.

Revenue Insights: Union Pacific Corporation and Ferguson plc Performance Compared