| __timestamp | Ingersoll Rand Inc. | Pool Corporation |
|---|---|---|
| Wednesday, January 1, 2014 | 2570005000 | 2246562000 |
| Thursday, January 1, 2015 | 2126900000 | 2363139000 |
| Friday, January 1, 2016 | 1939436000 | 2570803000 |
| Sunday, January 1, 2017 | 2375400000 | 2788188000 |
| Monday, January 1, 2018 | 2689800000 | 2998097000 |
| Tuesday, January 1, 2019 | 2451900000 | 3199517000 |
| Wednesday, January 1, 2020 | 4910200000 | 3936623000 |
| Friday, January 1, 2021 | 5152400000 | 5295584000 |
| Saturday, January 1, 2022 | 5916300000 | 6179727000 |
| Sunday, January 1, 2023 | 6876100000 | 5541595000 |
| Monday, January 1, 2024 | 0 |
Unleashing insights
In the ever-evolving landscape of industrial and consumer goods, Ingersoll Rand Inc. and Pool Corporation have emerged as formidable players. Over the past decade, these companies have demonstrated remarkable resilience and growth. From 2014 to 2023, Ingersoll Rand's revenue surged by approximately 167%, while Pool Corporation saw an impressive 147% increase.
Ingersoll Rand's revenue growth took a significant leap in 2020, with a 100% increase compared to the previous year, marking a pivotal moment in its financial trajectory. Meanwhile, Pool Corporation experienced its peak growth in 2021, with a 35% rise from 2020.
As we look to the future, these companies continue to innovate and adapt, setting the stage for further growth. Investors and industry watchers alike will be keen to see how these trends evolve in the coming years.
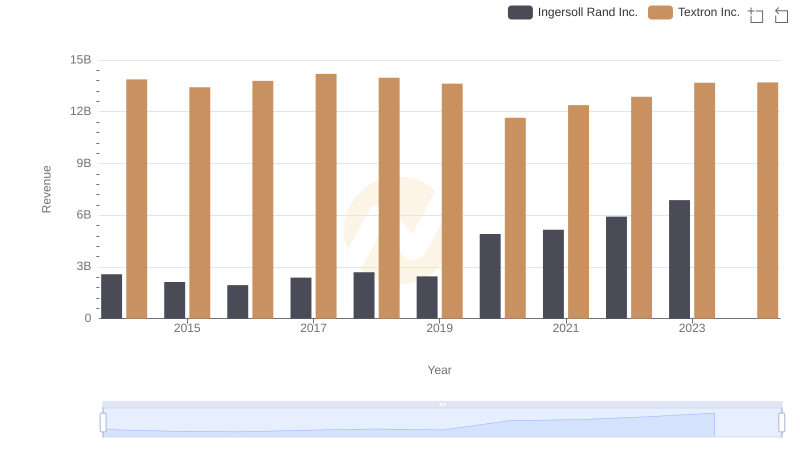
Breaking Down Revenue Trends: Ingersoll Rand Inc. vs Textron Inc.
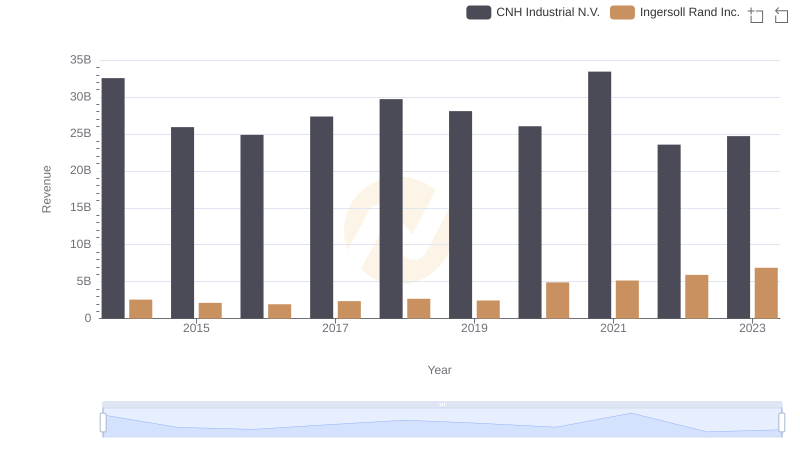
Ingersoll Rand Inc. vs CNH Industrial N.V.: Annual Revenue Growth Compared

Ingersoll Rand Inc. vs AECOM: Examining Key Revenue Metrics
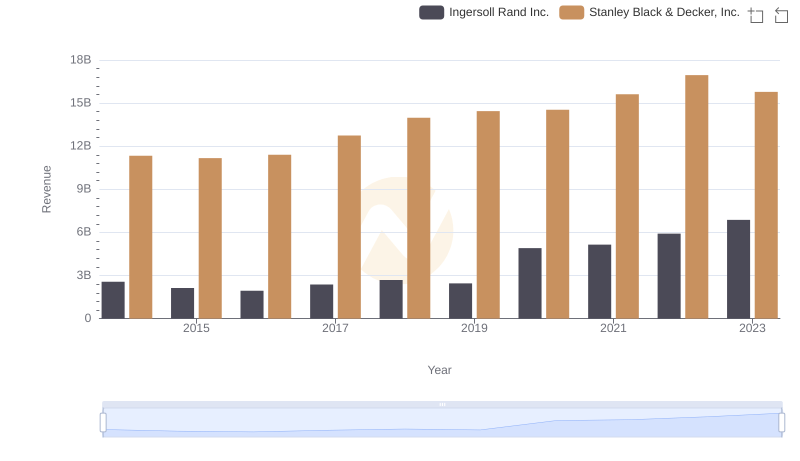
Ingersoll Rand Inc. or Stanley Black & Decker, Inc.: Who Leads in Yearly Revenue?
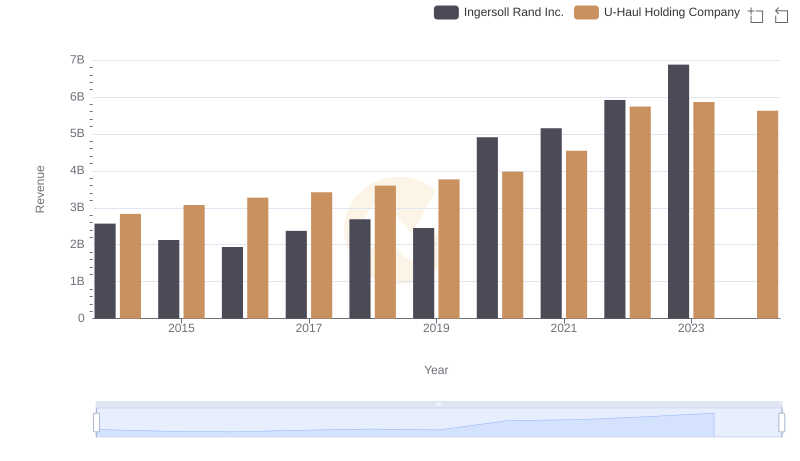
Revenue Showdown: Ingersoll Rand Inc. vs U-Haul Holding Company
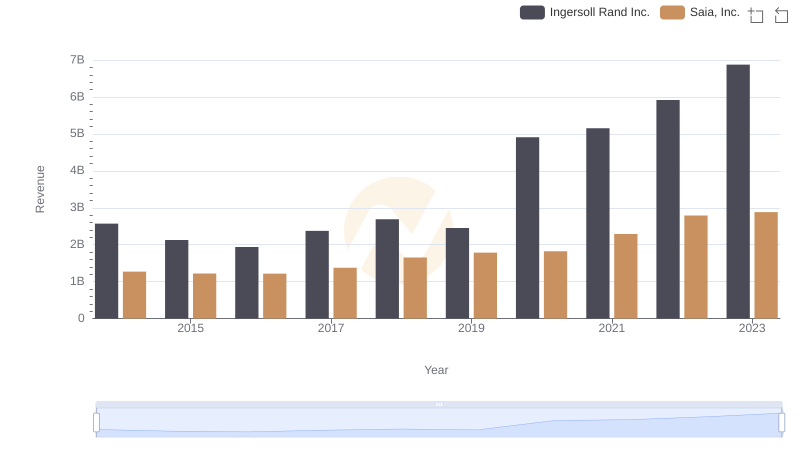
Ingersoll Rand Inc. and Saia, Inc.: A Comprehensive Revenue Analysis
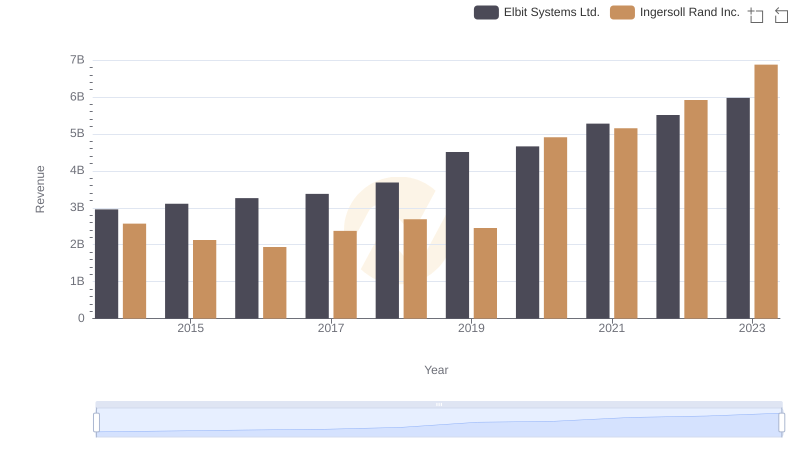
Comparing Revenue Performance: Ingersoll Rand Inc. or Elbit Systems Ltd.?
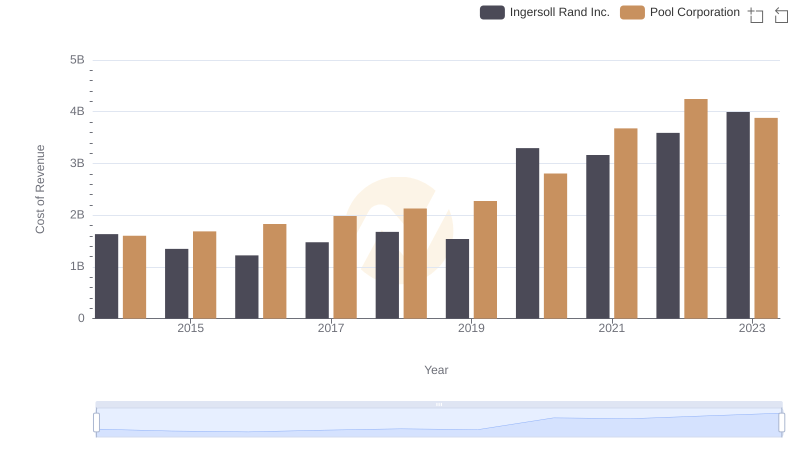
Cost Insights: Breaking Down Ingersoll Rand Inc. and Pool Corporation's Expenses