| __timestamp | Eaton Corporation plc | Graco Inc. |
|---|---|---|
| Wednesday, January 1, 2014 | 22552000000 | 1221130000 |
| Thursday, January 1, 2015 | 20855000000 | 1286485000 |
| Friday, January 1, 2016 | 19747000000 | 1329293000 |
| Sunday, January 1, 2017 | 20404000000 | 1474744000 |
| Monday, January 1, 2018 | 21609000000 | 1653292000 |
| Tuesday, January 1, 2019 | 21390000000 | 1646045000 |
| Wednesday, January 1, 2020 | 17858000000 | 1650115000 |
| Friday, January 1, 2021 | 19628000000 | 1987608000 |
| Saturday, January 1, 2022 | 20752000000 | 2143521000 |
| Sunday, January 1, 2023 | 23196000000 | 2195606000 |
| Monday, January 1, 2024 | 24878000000 | 2113316000 |
Unleashing insights
In the ever-evolving landscape of industrial manufacturing, Eaton Corporation plc and Graco Inc. have showcased intriguing revenue trajectories over the past decade. From 2014 to 2023, Eaton's revenue demonstrated a steady growth, peaking in 2023 with a 15% increase from its 2014 figures. Meanwhile, Graco Inc. exhibited a robust upward trend, with its revenue surging by approximately 80% over the same period.
Eaton's revenue dipped slightly in 2020, likely due to global economic challenges, but rebounded strongly in subsequent years. Graco, on the other hand, maintained a consistent growth trajectory, reflecting its strategic market positioning and resilience.
While Eaton's data for 2024 is unavailable, Graco's continued growth suggests a promising future. This analysis underscores the dynamic nature of the industrial sector and the importance of strategic adaptability.

Who Generates More Revenue? Eaton Corporation plc or ZTO Express (Cayman) Inc.

Comparing Revenue Performance: Eaton Corporation plc or CNH Industrial N.V.?

Eaton Corporation plc vs AECOM: Examining Key Revenue Metrics
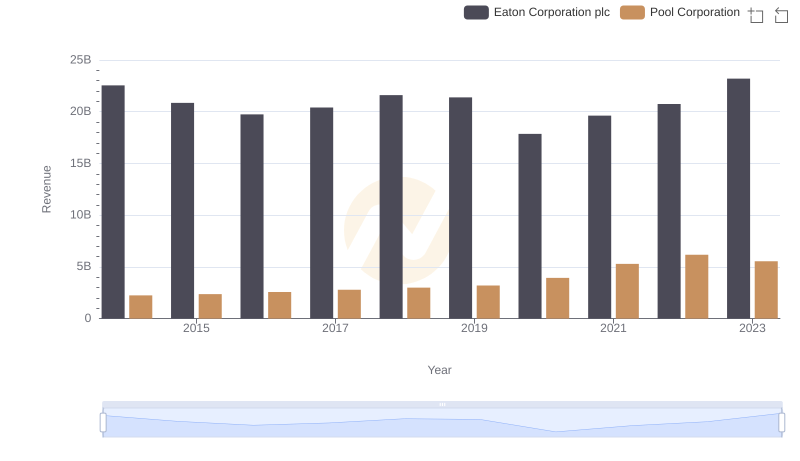
Eaton Corporation plc vs Pool Corporation: Annual Revenue Growth Compared
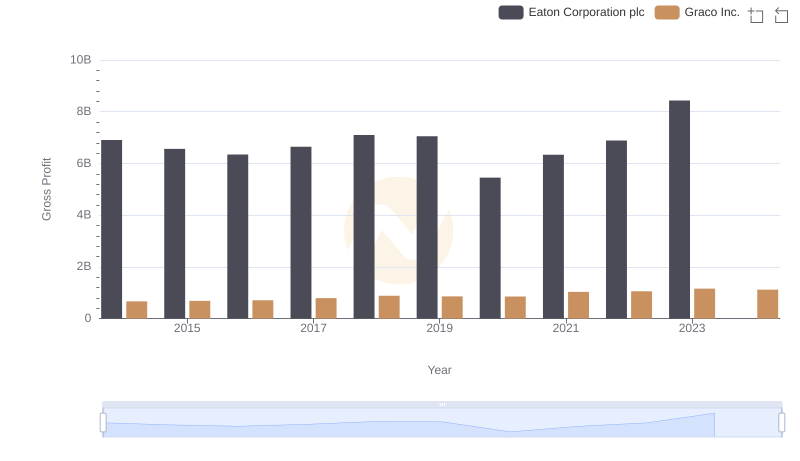
Gross Profit Comparison: Eaton Corporation plc and Graco Inc. Trends