| __timestamp | Eaton Corporation plc | Jacobs Engineering Group Inc. |
|---|---|---|
| Wednesday, January 1, 2014 | 22552000000 | 12695157000 |
| Thursday, January 1, 2015 | 20855000000 | 12114832000 |
| Friday, January 1, 2016 | 19747000000 | 10964157000 |
| Sunday, January 1, 2017 | 20404000000 | 10022788000 |
| Monday, January 1, 2018 | 21609000000 | 14984646000 |
| Tuesday, January 1, 2019 | 21390000000 | 12737868000 |
| Wednesday, January 1, 2020 | 17858000000 | 13566975000 |
| Friday, January 1, 2021 | 19628000000 | 14092632000 |
| Saturday, January 1, 2022 | 20752000000 | 14922825000 |
| Sunday, January 1, 2023 | 23196000000 | 16352414000 |
| Monday, January 1, 2024 | 24878000000 | 11500941000 |
Unlocking the unknown
In the ever-evolving landscape of industrial giants, Eaton Corporation plc and Jacobs Engineering Group Inc. have showcased intriguing revenue trajectories over the past decade. From 2014 to 2023, Eaton's revenue experienced a modest decline of approximately 3% before rebounding with a 17% increase by 2023. Meanwhile, Jacobs Engineering saw a steady growth of around 29% during the same period, highlighting its resilience and strategic adaptability.
Eaton's revenue peaked in 2023, reaching its highest point in the decade, while Jacobs Engineering consistently expanded its market presence, culminating in a significant revenue surge in 2023. Notably, the data for 2024 is incomplete, leaving room for speculation on future trends. This analysis underscores the dynamic nature of the industrial sector and the strategic maneuvers companies must employ to thrive.
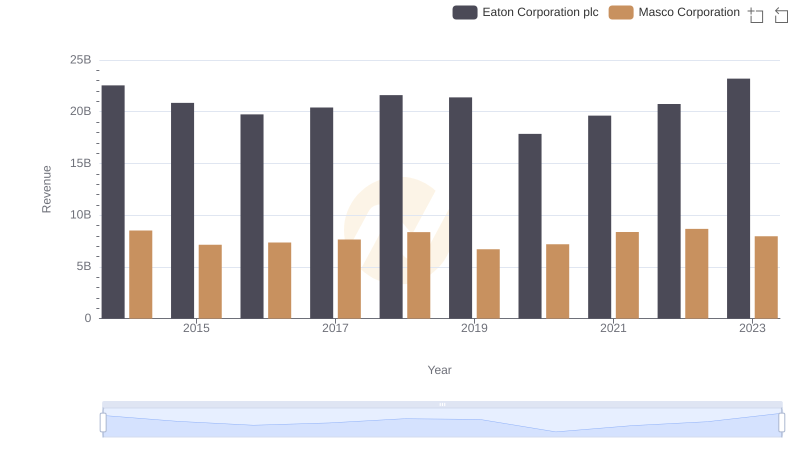
Eaton Corporation plc vs Masco Corporation: Examining Key Revenue Metrics

Comparing Revenue Performance: Eaton Corporation plc or Booz Allen Hamilton Holding Corporation?
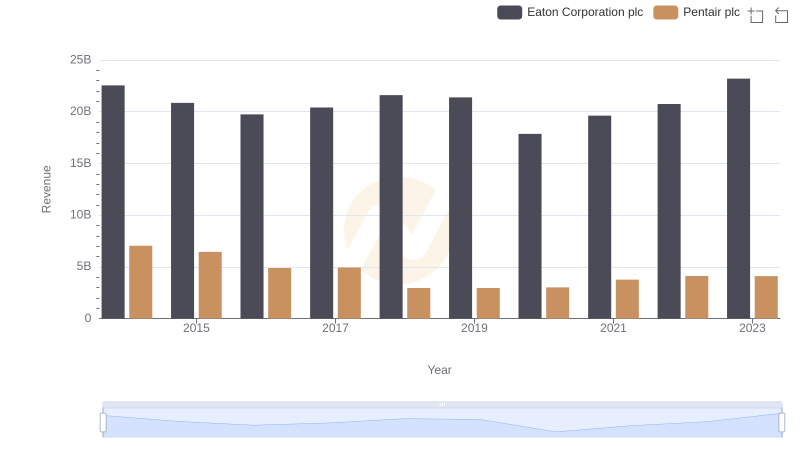
Comparing Revenue Performance: Eaton Corporation plc or Pentair plc?

Revenue Insights: Eaton Corporation plc and IDEX Corporation Performance Compared
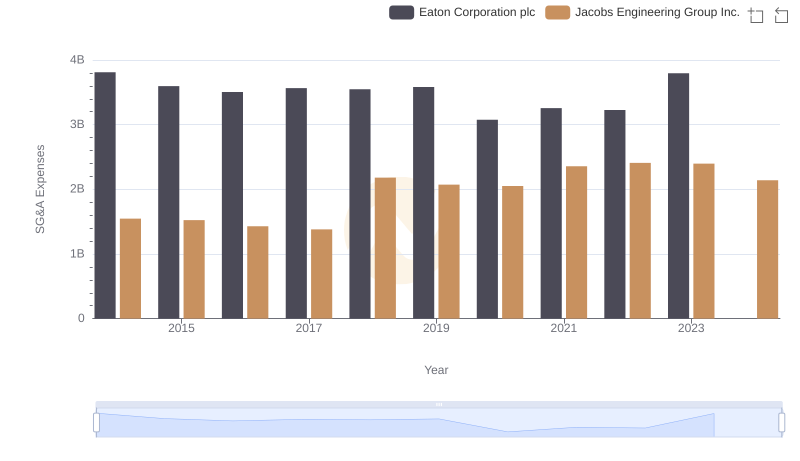
Eaton Corporation plc vs Jacobs Engineering Group Inc.: SG&A Expense Trends
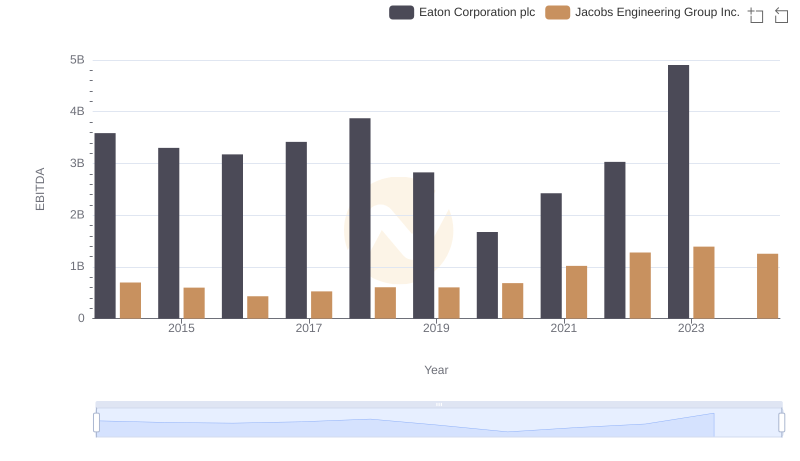
EBITDA Metrics Evaluated: Eaton Corporation plc vs Jacobs Engineering Group Inc.