| __timestamp | Eaton Corporation plc | IDEX Corporation |
|---|---|---|
| Wednesday, January 1, 2014 | 22552000000 | 2147767000 |
| Thursday, January 1, 2015 | 20855000000 | 2020668000 |
| Friday, January 1, 2016 | 19747000000 | 2113043000 |
| Sunday, January 1, 2017 | 20404000000 | 2287312000 |
| Monday, January 1, 2018 | 21609000000 | 2483666000 |
| Tuesday, January 1, 2019 | 21390000000 | 2494573000 |
| Wednesday, January 1, 2020 | 17858000000 | 2351646000 |
| Friday, January 1, 2021 | 19628000000 | 2764800000 |
| Saturday, January 1, 2022 | 20752000000 | 3181900000 |
| Sunday, January 1, 2023 | 23196000000 | 3273900000 |
| Monday, January 1, 2024 | 24878000000 | 3268800000 |
Data in motion
In the competitive landscape of industrial manufacturing, Eaton Corporation plc and IDEX Corporation have showcased intriguing revenue trajectories over the past decade. From 2014 to 2023, Eaton's revenue fluctuated, peaking in 2023 with a 13% increase from its 2014 figures. Meanwhile, IDEX Corporation demonstrated a steady upward trend, culminating in a 52% revenue growth over the same period.
Eaton's revenue dip in 2020, likely influenced by global economic challenges, was followed by a robust recovery, highlighting its resilience. In contrast, IDEX's consistent growth underscores its strategic market positioning and adaptability.
These insights not only reflect the companies' financial health but also offer a glimpse into their strategic maneuvers in a dynamic market. As we look to the future, the performance of these industrial giants will be pivotal in shaping industry trends.

Comparing Revenue Performance: Eaton Corporation plc or Booz Allen Hamilton Holding Corporation?
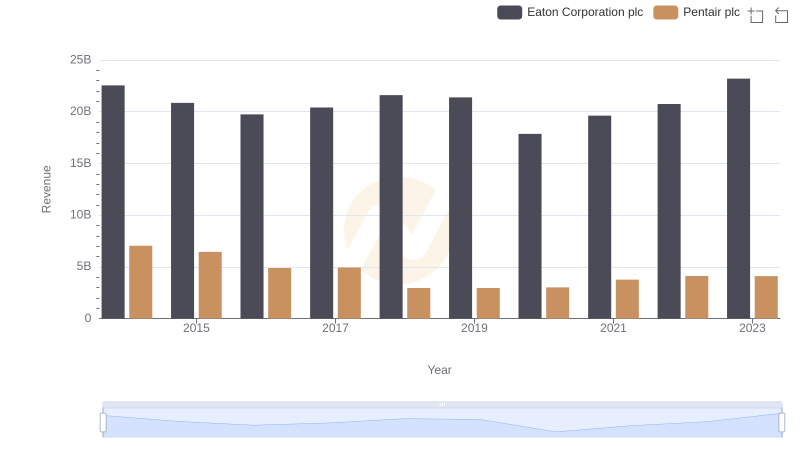
Comparing Revenue Performance: Eaton Corporation plc or Pentair plc?
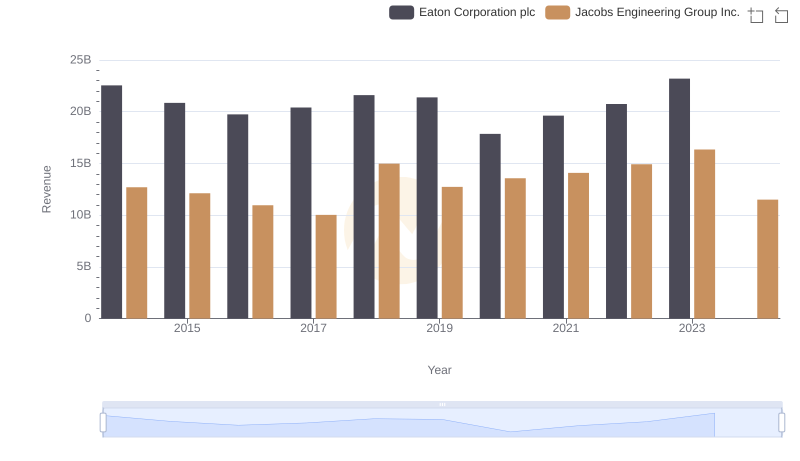
Breaking Down Revenue Trends: Eaton Corporation plc vs Jacobs Engineering Group Inc.
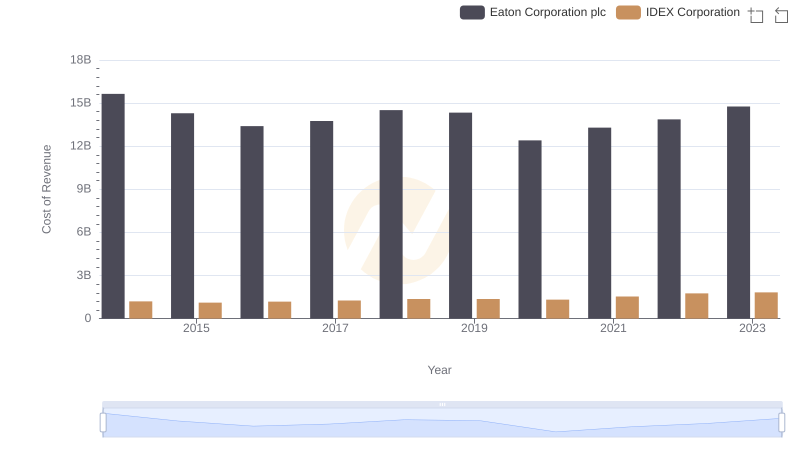
Comparing Cost of Revenue Efficiency: Eaton Corporation plc vs IDEX Corporation
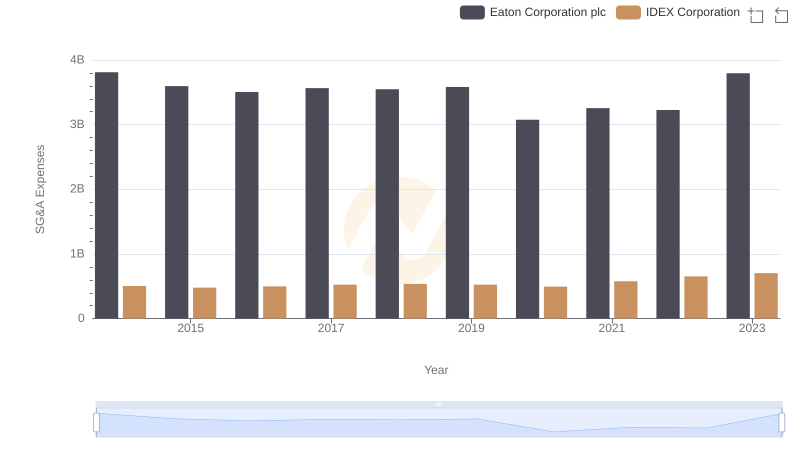
Selling, General, and Administrative Costs: Eaton Corporation plc vs IDEX Corporation