| __timestamp | AMETEK, Inc. | Eaton Corporation plc |
|---|---|---|
| Wednesday, January 1, 2014 | 1023344000 | 3586000000 |
| Thursday, January 1, 2015 | 1093776000 | 3302000000 |
| Friday, January 1, 2016 | 1007213000 | 3176000000 |
| Sunday, January 1, 2017 | 1068174000 | 3418000000 |
| Monday, January 1, 2018 | 1269415000 | 3875000000 |
| Tuesday, January 1, 2019 | 1411422000 | 2827000000 |
| Wednesday, January 1, 2020 | 1283159000 | 1674000000 |
| Friday, January 1, 2021 | 1600782000 | 2423000000 |
| Saturday, January 1, 2022 | 1820119000 | 3031000000 |
| Sunday, January 1, 2023 | 2025843000 | 4904000000 |
| Monday, January 1, 2024 | 1779562000 | 5547999771 |
Igniting the spark of knowledge
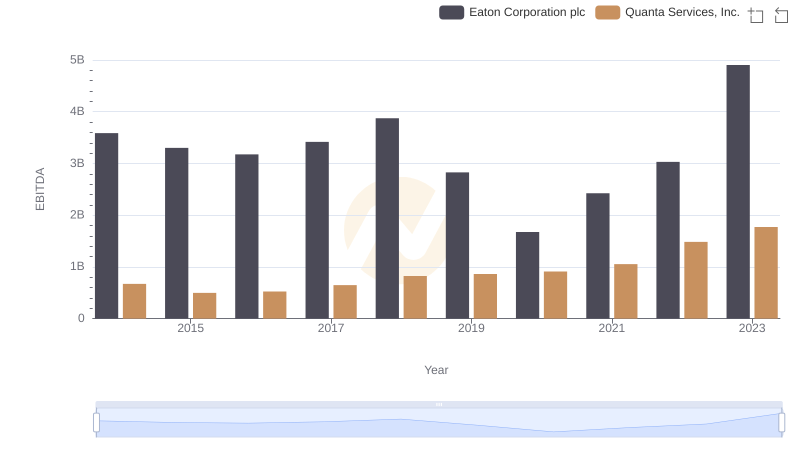
In the ever-evolving landscape of industrial manufacturing, Eaton Corporation plc and AMETEK, Inc. have emerged as formidable players. Over the past decade, from 2014 to 2023, these companies have demonstrated significant financial performance, particularly in terms of EBITDA—a key indicator of operational profitability.
Eaton Corporation plc has consistently outperformed AMETEK, Inc., with an average EBITDA nearly 2.4 times higher. Notably, Eaton's EBITDA peaked in 2023, reaching a staggering 4.9 billion, marking a 190% increase from its 2020 low. Meanwhile, AMETEK, Inc. showed steady growth, achieving a 100% increase in EBITDA over the same period, culminating in 2023.
This analysis underscores Eaton's robust financial health and strategic prowess, while AMETEK's steady ascent highlights its resilience and potential for future growth. Investors and industry analysts should keep a keen eye on these trends as they navigate the industrial sector's dynamic landscape.