| __timestamp | AMETEK, Inc. | Eaton Corporation plc |
|---|---|---|
| Wednesday, January 1, 2014 | 462637000 | 3810000000 |
| Thursday, January 1, 2015 | 448592000 | 3596000000 |
| Friday, January 1, 2016 | 462970000 | 3505000000 |
| Sunday, January 1, 2017 | 533645000 | 3565000000 |
| Monday, January 1, 2018 | 584022000 | 3548000000 |
| Tuesday, January 1, 2019 | 610280000 | 3583000000 |
| Wednesday, January 1, 2020 | 515630000 | 3075000000 |
| Friday, January 1, 2021 | 603944000 | 3256000000 |
| Saturday, January 1, 2022 | 644577000 | 3227000000 |
| Sunday, January 1, 2023 | 677006000 | 3795000000 |
| Monday, January 1, 2024 | 696905000 | 4077000000 |
Igniting the spark of knowledge
In the ever-evolving landscape of corporate finance, managing Selling, General, and Administrative (SG&A) expenses is crucial for maintaining profitability. This analysis delves into the SG&A expenses of Eaton Corporation plc and AMETEK, Inc. over the past decade, from 2014 to 2023.
Eaton Corporation, a leader in power management, has seen its SG&A expenses fluctuate, peaking in 2014 and 2023. Despite a dip in 2020, Eaton's expenses have remained relatively stable, averaging around $3.5 billion annually. In contrast, AMETEK, Inc., a global manufacturer of electronic instruments, has demonstrated a consistent upward trend, with expenses growing by approximately 46% over the same period.
This comparison highlights the strategic differences in cost management between these two industry titans, offering valuable insights for investors and financial analysts alike.
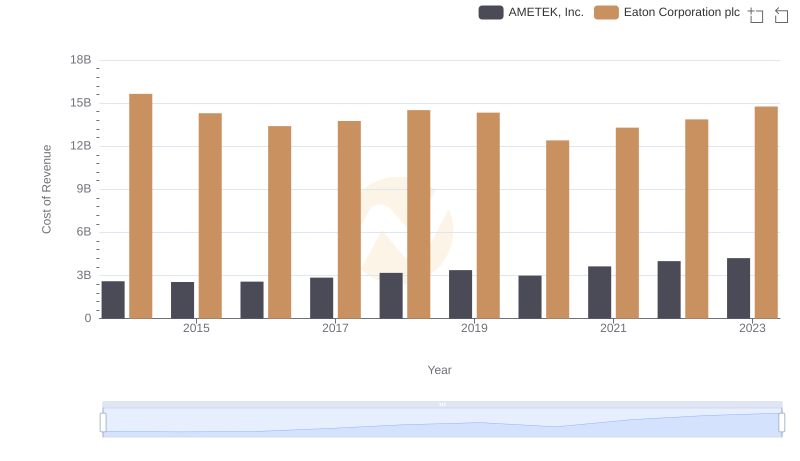
Comparing Cost of Revenue Efficiency: Eaton Corporation plc vs AMETEK, Inc.
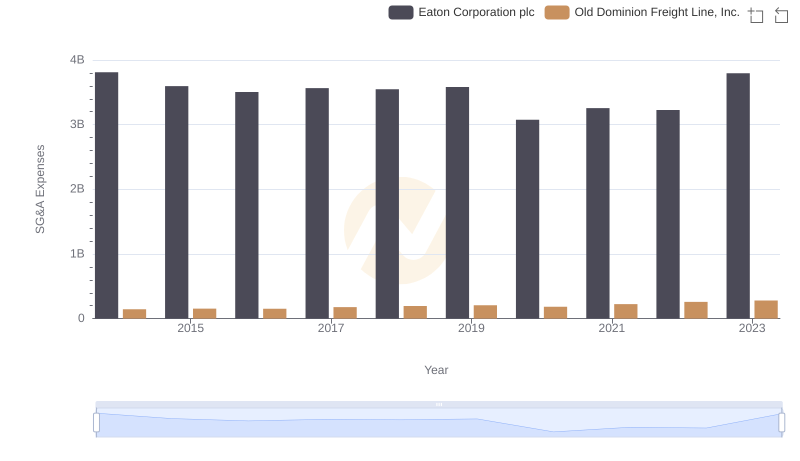
Eaton Corporation plc or Old Dominion Freight Line, Inc.: Who Manages SG&A Costs Better?
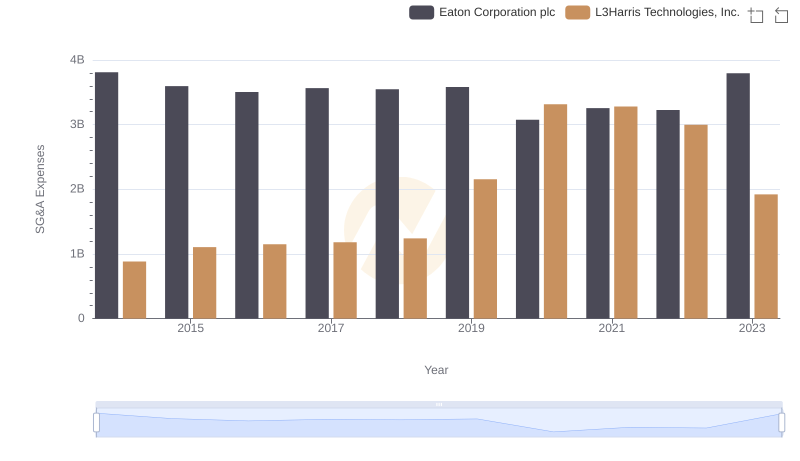
Who Optimizes SG&A Costs Better? Eaton Corporation plc or L3Harris Technologies, Inc.
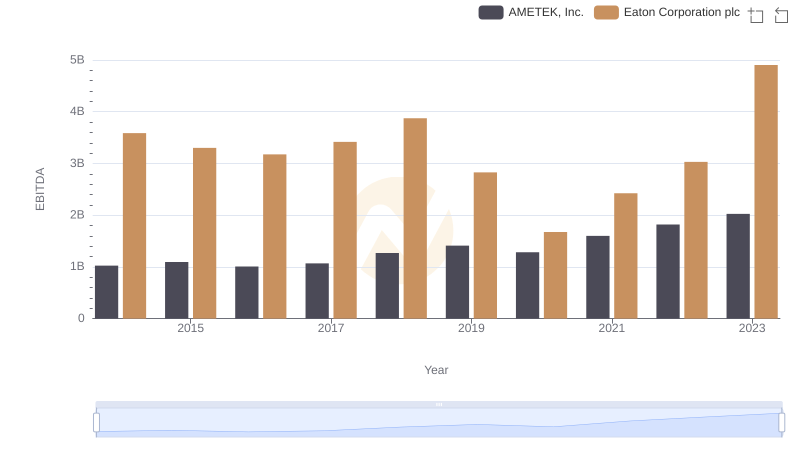
A Professional Review of EBITDA: Eaton Corporation plc Compared to AMETEK, Inc.